
Which of the following statements is INCORRECT?
Collecting primary data is not quite expensive both, in the terms of time and money.
Primary Data: Identifying the Incorrect Statement
This section provides a detailed explanation to identify the INCORRECT statement about primary data from the given options. We will analyze each statement based on the characteristics of primary data.
What is Primary Data?
Primary data is raw information collected directly from the source for the first time. Researchers gather this data specifically for their study using methods like surveys, interviews, observations, or experiments. Because it's collected firsthand, it is often considered original and more tailored to the research needs.
Evaluating Each Statement About Primary Data
-
Statement 1: Collecting primary data is not quite expensive both, in the terms of time and money.
- This statement suggests that gathering primary data is relatively cheap and quick.
- However, in practice, collecting primary data usually involves significant resources. It requires careful planning, designing research instruments (like questionnaires), fieldwork, travel, personnel costs, and time for data collection and processing.
- For example, conducting a large-scale survey or a series of in-depth interviews requires considerable investment of both time and money.
- Therefore, this statement is generally considered false.
-
Statement 2: Primary data are original.
- This statement is true. As primary data is collected directly from the source for the first time by the researcher for their specific purpose, it is inherently original.
-
Statement 3: Primary data are those that are collected for the first time.
- This statement accurately defines primary data. The key characteristic is that it is newly gathered information, not previously collected or analyzed by others.
- Conclusion: This statement is correct.
-
Statement 4: Primary data are more reliable and suitable.
- This statement is generally true. Since the data is collected specifically for the research objective, the methodology can be controlled by the researcher to ensure accuracy and relevance.
- This makes primary data often more reliable and better suited to the specific research question compared to secondary data, which might have been collected for different purposes or using different standards.
- Conclusion: This statement is correct.
Conclusion on the Incorrect Statement
By analyzing each option, we find that the statement claiming primary data collection is not expensive in terms of time and money is inaccurate. The process is typically resource-intensive.
Thus, the INCORRECT statement is: Collecting primary data is not quite expensive both, in the terms of time and money.
Similar Questions
Following histogram shows certain frequency distribution against class intervals.
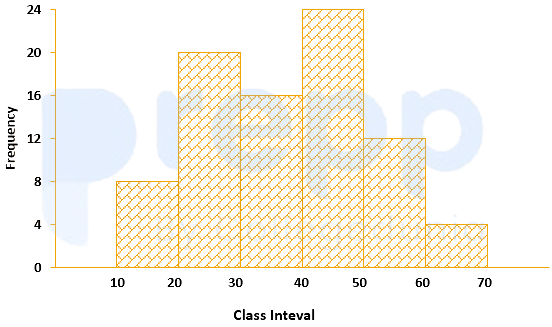
The approximated mean of this distribution is:
The annual vehicles production (in lacs) in india is given in the pie chart.
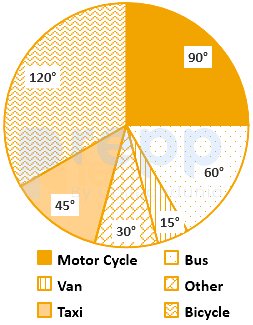
If the annual production of motor cycle is 1.80 lacs, the annual production of Bicycle is
For determination of mode and median graphically, one considers:
The curve obtained by joining the points, whose x-coordinates are the upper limits of the class interval and y-coordinates are corresponding cumulative frequencies is called:
The variation among the observations of each specific class is known as:
For making frequency distribution, the number of classes used depends upon:
When the collected data is grouped with reference to time, we have
Mutual and unique variances among multiple factors can be embodied in a diagram that comprises overlapping circles. The diagram is known as:
Which of the following is a method of collection of primary data?
The grouped data for the observation are
Class: 1-3 3-5 5-7 Frequency: 2 1 2 The population skewness
Important Questions from Classification of Data
The class marks in a frequency table are given to be 5, 10, 15, 20, 25, 30, 35, 40, 45, 50. The class limits of the first five classes are
In a test in Mathematics, 20% of the students obtained “first class”. If the data are represented by a Pie-Chart, what is the central angle corresponding to “first class”?
The following table gives the monthly expenditure of two families:
Expenditure (in Rs.)
Items
Family A
Family B
Food
3,500
2,700
Clothing
500
800
Rent
1,500
1,000
Education
2,000
1,800
Miscellaneous
2,500
1,800
In constructing a pie diagram to the above data, the radii of the circles are to be chosen by which one of the following ratios?
In an examination, 40% of candidates got second class. When the data are represented by a pie chart, what is the angle corresponding to second class?
Following histogram shows certain frequency distribution against class intervals.
The approximated mean of this distribution is:



