
For the following frequency distribution the value of mode is:Class: 3-5 5-7 7-9 9-11 Frequency: 1 4 2 1
6.20
Calculating Mode for Grouped Frequency Data
To find the mode for a grouped frequency distribution, we first need to identify the modal class. The modal class is the class interval with the highest frequency. Once we have the modal class, we use a specific formula to calculate the mode.
Steps to Calculate Mode
- Identify the modal class: This is the class interval with the maximum frequency.
- Determine the lower limit (L) of the modal class.
- Identify the frequency ($f_1$) of the modal class.
- Identify the frequency ($f_0$) of the class preceding the modal class.
- Identify the frequency ($f_2$) of the class succeeding the modal class.
- Calculate the class width (h), which is the difference between the upper and lower limits of any class interval (assuming uniform width).
- Apply the formula for the mode of grouped data.
Applying the Formula to the Frequency Distribution
The given frequency distribution is:
| Class | Frequency |
|---|---|
| 3-5 | 1 |
| 5-7 | 4 |
| 7-9 | 2 |
| 9-11 | 1 |
Let's follow the steps:
- The highest frequency is 4, which corresponds to the class 5-7. So, the modal class is 5-7.
- The lower limit of the modal class (L) is 5.
- The frequency of the modal class ($f_1$) is 4.
- The frequency of the class preceding the modal class ($f_0$), which is the class 3-5, is 1.
- The frequency of the class succeeding the modal class ($f_2$), which is the class 7-9, is 2.
- The class width (h) is 7 - 5 = 2. (We can also check other classes: 5-3=2, 9-7=2, 11-9=2. The width is uniform).
The formula for the mode of grouped data is:
$\text{Mode} = L + \left( \frac{f_1 - f_0}{2f_1 - f_0 - f_2} \right) \times h$
Now, substitute the values into the formula:
$\text{Mode} = 5 + \left( \frac{4 - 1}{2(4) - 1 - 2} \right) \times 2$
$\text{Mode} = 5 + \left( \frac{3}{8 - 1 - 2} \right) \times 2$
$\text{Mode} = 5 + \left( \frac{3}{5} \right) \times 2$
$\text{Mode} = 5 + (0.6) \times 2$
$\text{Mode} = 5 + 1.2$
$\text{Mode} = 6.2$
Thus, the value of the mode for the given frequency distribution is 6.2.
Comparing with Options
- Option 1: 6.25
- Option 2: 6.00
- Option 3: 6.20
- Option 4: 6.40
Our calculated value, 6.2, matches Option 3 (6.20).
Revision Table: Key Concepts for Mode
| Concept | Description |
|---|---|
| Mode | The value that appears most frequently in a data set. |
| Modal Class | In a grouped frequency distribution, the class interval with the highest frequency. |
| Mode Formula (Grouped Data) | $\text{Mode} = L + \left( \frac{f_1 - f_0}{2f_1 - f_0 - f_2} \right) \times h$ |
| $L$ | Lower limit of the modal class. |
| $f_1$ | Frequency of the modal class. |
| $f_0$ | Frequency of the class preceding the modal class. |
| $f_2$ | Frequency of the class succeeding the modal class. |
| $h$ | Class width. |
Additional Information: Measures of Central Tendency
Mode is one of the three main measures of central tendency used in statistics to describe the center of a data set. The other two are Mean and Median.
- Mean: The average of all values in the data set. It is calculated by summing all values and dividing by the total number of values. For grouped data, it is an approximation calculated using class midpoints.
- Median: The middle value of a data set when it is arranged in ascending or descending order. For grouped data, it is calculated using a specific formula involving cumulative frequencies.
- Mode: As discussed, the most frequently occurring value. For grouped data, it is estimated using the modal class and the formula used above.
Each measure of central tendency provides a different perspective on the 'center' of the data and is useful in different situations. The mode is particularly useful for categorical or discrete data, or when identifying the most popular item or most common observation in a data set. In grouped data, the mode formula provides an estimate based on the frequency distribution.
Similar Questions
Following histogram shows certain frequency distribution against class intervals.
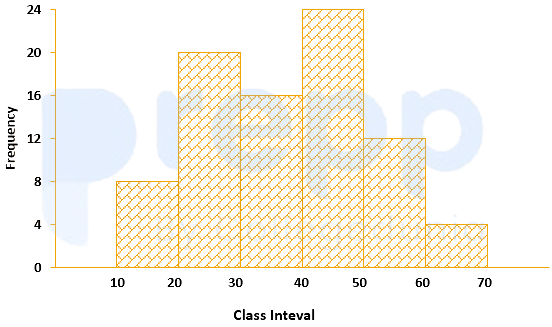
The approximated mean of this distribution is:
The annual vehicles production (in lacs) in india is given in the pie chart.
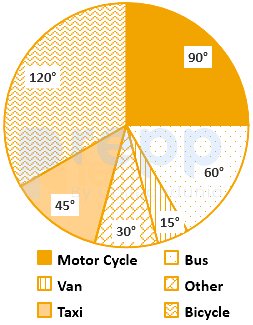
If the annual production of motor cycle is 1.80 lacs, the annual production of Bicycle is
For determination of mode and median graphically, one considers:
The curve obtained by joining the points, whose x-coordinates are the upper limits of the class interval and y-coordinates are corresponding cumulative frequencies is called:
The variation among the observations of each specific class is known as:
For making frequency distribution, the number of classes used depends upon:
When the collected data is grouped with reference to time, we have
Mutual and unique variances among multiple factors can be embodied in a diagram that comprises overlapping circles. The diagram is known as:
Which of the following is a method of collection of primary data?
The grouped data for the observation are
Class: 1-3 3-5 5-7 Frequency: 2 1 2 The population skewness
Important Questions from Classification of Data
The class marks in a frequency table are given to be 5, 10, 15, 20, 25, 30, 35, 40, 45, 50. The class limits of the first five classes are
In a test in Mathematics, 20% of the students obtained “first class”. If the data are represented by a Pie-Chart, what is the central angle corresponding to “first class”?
The following table gives the monthly expenditure of two families:
Expenditure (in Rs.)
Items
Family A
Family B
Food
3,500
2,700
Clothing
500
800
Rent
1,500
1,000
Education
2,000
1,800
Miscellaneous
2,500
1,800
In constructing a pie diagram to the above data, the radii of the circles are to be chosen by which one of the following ratios?
In an examination, 40% of candidates got second class. When the data are represented by a pie chart, what is the angle corresponding to second class?
Following histogram shows certain frequency distribution against class intervals.
The approximated mean of this distribution is:



