
Which of the following options is correct when data is classified on the basis of attributes?
Qualitative classification
Understanding Data Classification Based on Attributes
Data classification is a fundamental step in statistics where raw data is organized into groups or classes based on certain characteristics. This helps in simplifying the data, making it easier to analyze, interpret, and understand patterns and relationships. The question asks about the specific type of classification done on the basis of attributes.
Classifying Data by Attributes
When data is classified based on characteristics that cannot be measured numerically, these characteristics are called attributes. Attributes are qualitative in nature. Examples include gender (Male/Female), religion (Hindu, Muslim, Christian, etc.), nationality (Indian, American, etc.), quality (Good, Bad, Average), marital status (Married, Unmarried), etc.
The classification of data based on such attributes is known as Qualitative Classification. This type of classification groups data points according to their shared qualitative characteristics.
Examining the Options
Let's look at the provided options and understand why Qualitative classification is the correct answer when data is classified on the basis of attributes:
- Qualitative classification: This is precisely the method used when data is grouped according to non-numerical characteristics or attributes.
- Geographical classification: This method classifies data based on geographical location, such as states, cities, regions, or countries. While location can be considered an attribute, the specific term for classification by location is Geographical classification, not general attribute-based classification.
- Geological classification: This term refers to the classification of geological phenomena, rocks, minerals, etc., based on their properties or formation. It is a specific type of classification within geology, not a general method for classifying data based on attributes.
- Temporal classification: This method classifies data based on time, such as years, quarters, months, weeks, or days. It's also known as chronological classification. This is based on time, not general non-temporal attributes.
Therefore, when the basis of classification is attributes in a general statistical context, the correct term is Qualitative classification.
Conclusion on Data Classification
Based on the definitions and common statistical terminology, classifying data according to its non-numerical attributes leads to Qualitative classification. The other options describe classification based on specific criteria like location (Geographical) or time (Temporal), or a highly specific scientific field (Geological).
The final answer is Qualitative classification.
| Type of Classification | Basis of Classification | Examples |
|---|---|---|
| Qualitative Classification | Attributes (non-numerical characteristics) | Gender, Religion, Nationality, Quality |
| Geographical Classification | Location | States, Cities, Regions, Countries |
| Temporal Classification | Time | Years, Months, Days |
| Quantitative Classification | Measurable Characteristics (Variables) | Height, Weight, Income, Marks |
Revision Table: Key Classification Types
| Classification Type | Basis |
|---|---|
| Qualitative | Attributes (Qualities) |
| Quantitative | Variables (Quantities) |
| Temporal | Time |
| Geographical | Location |
Additional Information on Data Types
Understanding data types is important for classification. Data can be broadly categorized as:
- Qualitative Data: Describes qualities or characteristics. It cannot be measured numerically but can be categorized. Examples: Color of eyes, type of car, name.
- Quantitative Data: Represents quantities that can be measured numerically. Examples: Height, weight, number of students. Quantitative data can be further divided into Discrete (countable whole numbers) and Continuous (measurable on a scale).
Classification helps in converting raw data into a systematic form, making it suitable for tabulation and further statistical analysis like calculating frequencies, averages, and dispersions, or creating charts and graphs.
Similar Questions
Following histogram shows certain frequency distribution against class intervals.
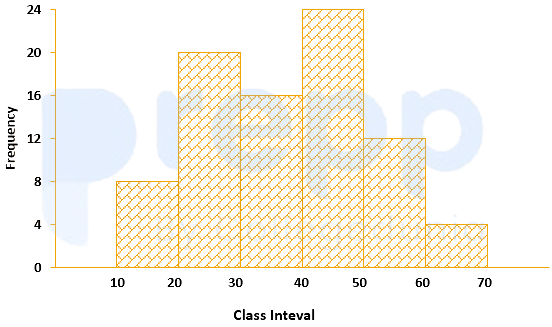
The approximated mean of this distribution is:
The annual vehicles production (in lacs) in india is given in the pie chart.
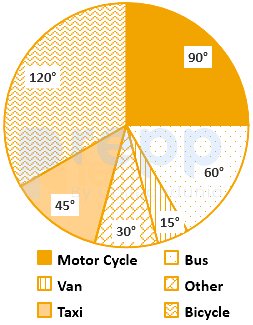
If the annual production of motor cycle is 1.80 lacs, the annual production of Bicycle is
For determination of mode and median graphically, one considers:
The curve obtained by joining the points, whose x-coordinates are the upper limits of the class interval and y-coordinates are corresponding cumulative frequencies is called:
The variation among the observations of each specific class is known as:
For making frequency distribution, the number of classes used depends upon:
When the collected data is grouped with reference to time, we have
Mutual and unique variances among multiple factors can be embodied in a diagram that comprises overlapping circles. The diagram is known as:
Which of the following is a method of collection of primary data?
The grouped data for the observation are
Class: 1-3 3-5 5-7 Frequency: 2 1 2 The population skewness
Important Questions from Classification of Data
The class marks in a frequency table are given to be 5, 10, 15, 20, 25, 30, 35, 40, 45, 50. The class limits of the first five classes are
In a test in Mathematics, 20% of the students obtained “first class”. If the data are represented by a Pie-Chart, what is the central angle corresponding to “first class”?
The following table gives the monthly expenditure of two families:
Expenditure (in Rs.)
Items
Family A
Family B
Food
3,500
2,700
Clothing
500
800
Rent
1,500
1,000
Education
2,000
1,800
Miscellaneous
2,500
1,800
In constructing a pie diagram to the above data, the radii of the circles are to be chosen by which one of the following ratios?
In an examination, 40% of candidates got second class. When the data are represented by a pie chart, what is the angle corresponding to second class?
Following histogram shows certain frequency distribution against class intervals.
The approximated mean of this distribution is:



