
If each observation in a data set for number of employees in different divisions is doubled then the coefficient of quartile deviation:
Understanding the Impact on Coefficient of Quartile Deviation When Observations are Doubled
This solution explains how the coefficient of quartile deviation changes when every value in a dataset is multiplied by two. We will look at the definitions of quartile deviation and its coefficient, and then analyze the effect of this transformation.
Defining Quartile Deviation
Quartile Deviation (QD) is a measure used in statistics to describe the spread or variability within the middle 50% of a dataset. It is calculated using the first quartile ($Q_1$) and the third quartile ($Q_3$).
The formula for Quartile Deviation is:
| $ \text{QD} = \frac{Q_3 - Q_1}{2} $ |
Here, $Q_1$ is the value below which 25% of the data falls, and $Q_3$ is the value below which 75% of the data falls.
Calculating the Coefficient of Quartile Deviation
The Coefficient of Quartile Deviation (CQD) is a relative measure of dispersion. It helps compare the spread of datasets with different scales. It is calculated by dividing the Quartile Deviation by the sum of the upper and lower quartiles.
The formula for the Coefficient of Quartile Deviation is:
| $ \text{CQD} = \frac{Q_3 - Q_1}{Q_3 + Q_1} $ |
Analyzing the Effect of Doubling Observations
Let's consider an original dataset: $x_1, x_2, x_3, ..., x_n$.
Now, imagine each observation in this dataset is doubled. The new dataset becomes: $2x_1, 2x_2, 2x_3, ..., 2x_n$.
When all observations in a dataset are multiplied by a constant value (let's call this constant '$k$'), the quartiles ($Q_1$ and $Q_3$) of the dataset are also multiplied by the same constant '$k$'. In this specific question, $k=2$.
Let the original quartiles be $Q_{1_{\text{original}}}$ and $Q_{3_{\text{original}}}$.
The new quartiles will be:
- $ Q_{1_{\text{new}}} = 2 \times Q_{1_{\text{original}}} $
- $ Q_{3_{\text{new}}} = 2 \times Q_{3_{\text{original}}} $
Now, let's calculate the Coefficient of Quartile Deviation for the new dataset:
$$ \text{CQD}_{\text{new}} = \frac{Q_{3_{\text{new}}} - Q_{1_{\text{new}}}}{Q_{3_{\text{new}}} + Q_{1_{\text{new}}}} $$
Substitute the new quartile values:
$$ \text{CQD}_{\text{new}} = \frac{(2 \times Q_{3_{\text{original}}}) - (2 \times Q_{1_{\text{original}}})}{(2 \times Q_{3_{\text{original}}}) + (2 \times Q_{1_{\text{original}}})} $$
Factor out the '2' from both the numerator and the denominator:
$$ \text{CQD}_{\text{new}} = \frac{2 \times (Q_{3_{\text{original}}} - Q_{1_{\text{original}}})}{2 \times (Q_{3_{\text{original}}} + Q_{1_{\text{original}}})} $$
Cancel out the common factor of 2:
$$ \text{CQD}_{\text{new}} = \frac{Q_{3_{\text{original}}} - Q_{1_{\text{original}}}}{Q_{3_{\text{original}}} + Q_{1_{\text{original}}}} $$
This is the formula for the original Coefficient of Quartile Deviation ($\text{CQD}_{\text{original}}$).
Therefore:
$$ \text{CQD}_{\text{new}} = \text{CQD}_{\text{original}} $$
Conclusion on Coefficient of Quartile Deviation
When each observation in a dataset is doubled, the coefficient of quartile deviation does not change. It remains the same because the scaling factor cancels out in the ratio calculation.
Similar Questions
Following histogram shows certain frequency distribution against class intervals.
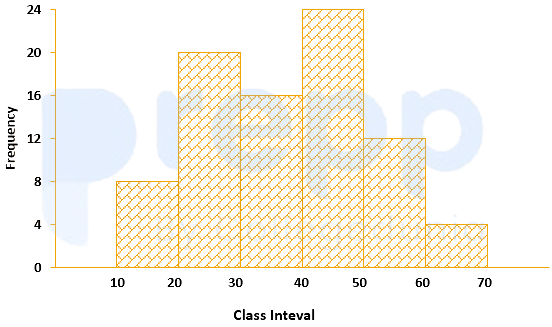
The approximated mean of this distribution is:
The annual vehicles production (in lacs) in india is given in the pie chart.
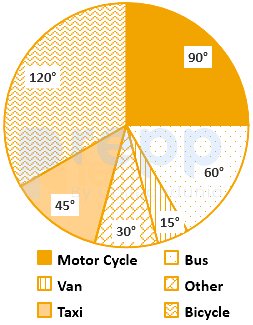
If the annual production of motor cycle is 1.80 lacs, the annual production of Bicycle is
For determination of mode and median graphically, one considers:
The curve obtained by joining the points, whose x-coordinates are the upper limits of the class interval and y-coordinates are corresponding cumulative frequencies is called:
The variation among the observations of each specific class is known as:
For making frequency distribution, the number of classes used depends upon:
When the collected data is grouped with reference to time, we have
Mutual and unique variances among multiple factors can be embodied in a diagram that comprises overlapping circles. The diagram is known as:
Which of the following is a method of collection of primary data?
The grouped data for the observation are
Class: 1-3 3-5 5-7 Frequency: 2 1 2 The population skewness
Important Questions from Classification of Data
The class marks in a frequency table are given to be 5, 10, 15, 20, 25, 30, 35, 40, 45, 50. The class limits of the first five classes are
In a test in Mathematics, 20% of the students obtained “first class”. If the data are represented by a Pie-Chart, what is the central angle corresponding to “first class”?
The following table gives the monthly expenditure of two families:
Expenditure (in Rs.)
Items
Family A
Family B
Food
3,500
2,700
Clothing
500
800
Rent
1,500
1,000
Education
2,000
1,800
Miscellaneous
2,500
1,800
In constructing a pie diagram to the above data, the radii of the circles are to be chosen by which one of the following ratios?
In an examination, 40% of candidates got second class. When the data are represented by a pie chart, what is the angle corresponding to second class?
Following histogram shows certain frequency distribution against class intervals.
The approximated mean of this distribution is:



