
The arithmetic mean of the following frequency distribution of number of accidents Xon week working days is:X: 2 4 6 8 10 12 Frequency: 3 4 2 1 4 2
6.625
The question asks for the arithmetic mean of a given frequency distribution. The frequency distribution shows the number of accidents (X) on week working days and the corresponding frequency for each number of accidents.
Calculating the Arithmetic Mean of a Frequency Distribution
The arithmetic mean for a frequency distribution is calculated using the formula:
$$ \bar{X} = \frac{\sum (f \times X)}{\sum f} $$
Where:
- $\bar{X}$ is the arithmetic mean.
- $X$ represents the value or class midpoint (in this case, the number of accidents).
- $f$ represents the frequency of each value.
- $\sum (f \times X)$ is the sum of the products of each value and its frequency.
- $\sum f$ is the sum of all frequencies (total number of observations).
Step-by-Step Arithmetic Mean Calculation
Let's organize the data and calculate the necessary sums. We have the number of accidents (X) and their frequencies (f):
| Number of Accidents (X) | Frequency (f) | f × X |
|---|---|---|
| 2 | 3 | 2 × 3 = 6 |
| 4 | 4 | 4 × 4 = 16 |
| 6 | 2 | 6 × 2 = 12 |
| 8 | 1 | 8 × 1 = 8 |
| 10 | 4 | 10 × 4 = 40 |
| 12 | 2 | 12 × 2 = 24 |
Now, we calculate the sum of frequencies ($\sum f$) and the sum of the products ($\sum (f \times X)$):
- Sum of frequencies ($\sum f$): $$ 3 + 4 + 2 + 1 + 4 + 2 = 16 $$
- Sum of products ($\sum (f \times X)$): $$ 6 + 16 + 12 + 8 + 40 + 24 = 106 $$
Finally, apply the formula for the arithmetic mean:
$$ \bar{X} = \frac{\sum (f \times X)}{\sum f} = \frac{106}{16} $$
Performing the division:
$$ \bar{X} = 6.625 $$
The arithmetic mean of the given frequency distribution is 6.625.
Revision Table: Key Statistics Concepts
| Concept | Definition | Calculation Method |
|---|---|---|
| Arithmetic Mean | A measure of central tendency; the average of a dataset. | Sum of values divided by the number of values (for raw data) or $$\frac{\sum (f \times X)}{\sum f}$$ (for frequency distribution). |
| Frequency Distribution | A table or graph that shows the frequency of different outcomes in a sample. | Organizes data into classes or categories and counts how many observations fall into each. |
| Summation ($\sum$) | The operation of adding a sequence of numbers. | Indicated by the Greek capital letter sigma. |
Additional Information: Understanding Frequency Distributions
A frequency distribution is a way to summarize data. It tells us how often each value or range of values appears in a dataset. In this problem, the frequency distribution shows how many working days had a specific number of accidents.
The arithmetic mean calculated from a frequency distribution is essentially a weighted average, where each value of X is weighted by its frequency. This is because the formula takes into account how many times each X value occurs in the dataset.
Understanding frequency distributions is fundamental in statistics as they are used to calculate various measures like the mean, median, mode, variance, and standard deviation, providing insights into the data's central tendency, spread, and shape.
Similar Questions
Following histogram shows certain frequency distribution against class intervals.
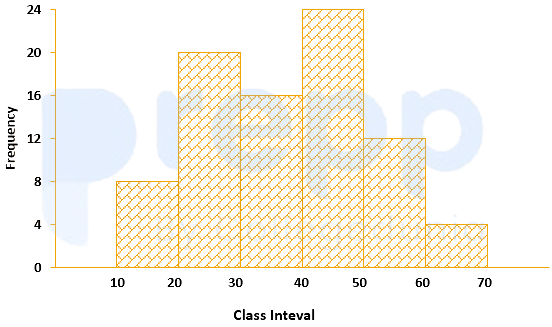
The approximated mean of this distribution is:
The annual vehicles production (in lacs) in india is given in the pie chart.
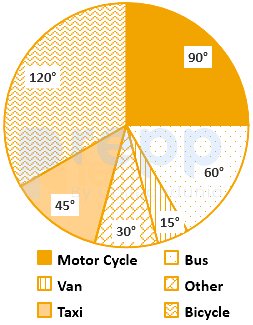
If the annual production of motor cycle is 1.80 lacs, the annual production of Bicycle is
For determination of mode and median graphically, one considers:
The curve obtained by joining the points, whose x-coordinates are the upper limits of the class interval and y-coordinates are corresponding cumulative frequencies is called:
The variation among the observations of each specific class is known as:
For making frequency distribution, the number of classes used depends upon:
When the collected data is grouped with reference to time, we have
Mutual and unique variances among multiple factors can be embodied in a diagram that comprises overlapping circles. The diagram is known as:
The graphical representation of the time series is known as:
Which of the following is a method of collection of primary data?
Important Questions from Classification of Data
The class marks in a frequency table are given to be 5, 10, 15, 20, 25, 30, 35, 40, 45, 50. The class limits of the first five classes are
In a test in Mathematics, 20% of the students obtained “first class”. If the data are represented by a Pie-Chart, what is the central angle corresponding to “first class”?
The following table gives the monthly expenditure of two families:
Expenditure (in Rs.)
Items
Family A
Family B
Food
3,500
2,700
Clothing
500
800
Rent
1,500
1,000
Education
2,000
1,800
Miscellaneous
2,500
1,800
In constructing a pie diagram to the above data, the radii of the circles are to be chosen by which one of the following ratios?
In an examination, 40% of candidates got second class. When the data are represented by a pie chart, what is the angle corresponding to second class?
Following histogram shows certain frequency distribution against class intervals.
The approximated mean of this distribution is:



