
Consider the following statements: Statement 1: Range is not a good measure of dispersion. Statement 2: Range is highly affected by the existence of extreme values. Which one of the following is correct in respect of the above statements?
Both Statement 1 and Statement 2 are correct and Statement 2 is the correct explanation of Statement 1
Understanding Range as a Measure of Dispersion
The Range is one of the simplest measures of dispersion used in statistics. It measures the spread of a data set by looking at the difference between the highest and lowest values in the set. The formula for Range is:
\( \text{Range} = \text{Maximum Value} - \text{Minimum Value} \)
While easy to calculate, its simplicity also leads to certain limitations as a measure of the overall spread or dispersion of the data.
Analyzing Statement 1: Is Range a Good Measure of Dispersion?
Statement 1 says: Range is not a good measure of dispersion.
This statement is generally considered correct in statistics. The range only uses two pieces of information from the data set: the absolute largest value and the absolute smallest value. It completely ignores all the data points in between. Because of this, it doesn't give a complete picture of how the data is distributed or clustered.
Analyzing Statement 2: Extreme Values and Range
Statement 2 says: Range is highly affected by the existence of extreme values.
This statement is also correct. Extreme values, also known as outliers, are data points that are significantly different from the other values in the data set. Since the Range is calculated using only the maximum and minimum values, if either of these values is an extreme value, it will significantly impact the Range, making it unrepresentative of the typical spread of the majority of the data points.
Consider these two data sets:
- Data Set A: 10, 12, 15, 18, 20
- Data Set B: 10, 12, 15, 18, 100
For Data Set A, Range = \(20 - 10 = 10\).
For Data Set B, Range = \(100 - 10 = 90\).
Data Set B has one extreme value (100) compared to Data Set A. As you can see, this single extreme value drastically increased the Range, even though the other four data points are the same in both sets. This example clearly shows how Range is highly affected by extreme values.
Evaluating the Relationship Between Statements 1 and 2
We have established that both Statement 1 and Statement 2 are correct.
Now, let's consider if Statement 2 is the correct explanation for Statement 1.
The reason why Range is not considered a good measure of dispersion (Statement 1) is precisely because it is highly influenced by extreme values (Statement 2) and ignores the distribution of the rest of the data. The vulnerability to outliers makes the Range unstable and less reliable than other measures like standard deviation or variance when dealing with data that might contain such values.
Therefore, Statement 2 provides the fundamental reason why Statement 1 is true. The characteristic described in Statement 2 directly explains the limitation mentioned in Statement 1.
Based on this analysis:
- Statement 1 is correct.
- Statement 2 is correct.
- Statement 2 correctly explains why Statement 1 is correct.
Revision Table: Range Properties
| Property | Description | Impact |
|---|---|---|
| Calculation Simplicity | Easy: Max - Min | Quick to compute |
| Data Usage | Uses only two extreme values | Ignores distribution of middle data |
| Sensitivity to Outliers | Highly affected by extreme values (max or min) | Can be misleading measure of typical spread |
Additional Information: Why Other Measures Are Preferred
Because Range is so sensitive to extreme values and ignores most of the data, other measures of dispersion are often preferred in statistical analysis, especially for data sets that might contain outliers or when a more robust measure of spread is needed. These include:
- Interquartile Range (IQR): The difference between the third quartile (Q3) and the first quartile (Q1). It measures the spread of the middle 50% of the data and is less affected by extreme values than the Range.
- Variance: The average of the squared differences from the mean.
- Standard Deviation: The square root of the variance. It measures the typical distance of data points from the mean. Variance and Standard Deviation consider all data points and provide a more comprehensive measure of dispersion, though they are also influenced by extreme values (but often less drastically than Range).
Understanding the limitations of Range highlights the need for different measures of dispersion depending on the data and the goal of the analysis.
Similar Questions
The class marks in a frequency table are given to be 5, 10, 15, 20, 25, 30, 35, 40, 45, 50. The class limits of the first five classes are
In a test in Mathematics, 20% of the students obtained “first class”. If the data are represented by a Pie-Chart, what is the central angle corresponding to “first class”?
The following table gives the monthly expenditure of two families:
Expenditure (in Rs.)
Items
Family A
Family B
Food
3,500
2,700
Clothing
500
800
Rent
1,500
1,000
Education
2,000
1,800
Miscellaneous
2,500
1,800
In constructing a pie diagram to the above data, the radii of the circles are to be chosen by which one of the following ratios?
In an examination, 40% of candidates got second class. When the data are represented by a pie chart, what is the angle corresponding to second class?
For a histogram based on a frequency distribution with unequal class intervals, the frequency of a class should be proportional to:
The numbers of Science, Arts and Commerce graduates working in a company are 30, 70 and 50 respectively. If these figures are represented by a pie chart, then what is the angle corresponding to Science graduates?
Data can be represented in which of the following forms?
1. Textual form
2. Tabula form
3. Graphical form
Select the correct answer using the code given below.Consider the following statements in respect of a histogram:
1. The total area of the rectangles in a histogram is equal to the total area bounded by the corresponding frequency polygon and the x-axis.
2. When class intervals are unequal in a frequency distribution, the area of the rectangle is proportional to the frequency.
Which of the above statements is/are correct?A set of annual numerical data, comparable over the years, is given for the last 12 years.
Consider the following statements:
1. The data is best represented by a broken line graph, each corner (turning point) representing the data of one year.
2. Such a graph depicts the chronological change and also enables one to make a short-term forecast.
Which of the above statements is/are correct?
Important Questions from Classification of Data
The class marks in a frequency table are given to be 5, 10, 15, 20, 25, 30, 35, 40, 45, 50. The class limits of the first five classes are
In a test in Mathematics, 20% of the students obtained “first class”. If the data are represented by a Pie-Chart, what is the central angle corresponding to “first class”?
The following table gives the monthly expenditure of two families:
Expenditure (in Rs.)
Items
Family A
Family B
Food
3,500
2,700
Clothing
500
800
Rent
1,500
1,000
Education
2,000
1,800
Miscellaneous
2,500
1,800
In constructing a pie diagram to the above data, the radii of the circles are to be chosen by which one of the following ratios?
In an examination, 40% of candidates got second class. When the data are represented by a pie chart, what is the angle corresponding to second class?
Following histogram shows certain frequency distribution against class intervals.
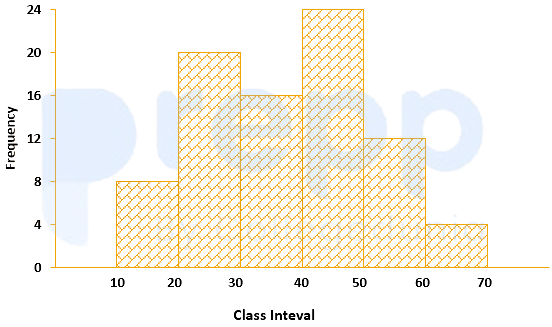
The approximated mean of this distribution is:



