The data about the sales and advertisement expenditure of a firm is given belowSales (in crore of Rs.) Advertisement exp (in crores of Rs.) Means 40 6 Standard Daviation 10 1.5
The correlation coefficient between sales and advertisement expenditure is 0.9. The likely sales for a proposed advertisement expenditure of Rs. 10 crore
Rs. 64 crores
Understanding Sales and Advertisement Expenditure Regression
This problem asks us to predict the likely sales of a firm based on a proposed advertisement expenditure. We are given data including the means and standard deviations of sales and advertisement expenditure, as well as the correlation coefficient between them. This information suggests that we can use linear regression analysis to find the relationship between these two variables and make a prediction.
Given Data for Sales and Advertisement
Let Sales be denoted by \(S\) and Advertisement Expenditure be denoted by \(A\). The given data is:
| Variable | Mean | Standard Deviation |
|---|---|---|
| Sales (in crore of Rs.) | \(\bar{S} = 40\) | \(\sigma_S = 10\) |
| Advertisement Exp (in crores of Rs.) | \(\bar{A} = 6\) | \(\sigma_A = 1.5\) |
We are also given the correlation coefficient between Sales and Advertisement Expenditure:
- Correlation coefficient, \(r = 0.9\)
We need to find the likely sales (\(S\)) when the advertisement expenditure (\(A\)) is Rs. 10 crore.
Applying Linear Regression for Sales Prediction
Since we want to predict Sales (\(S\)) based on Advertisement Expenditure (\(A\)), we need to find the regression line of \(S\) on \(A\). The general equation for the regression line of Y on X is:
\(Y - \bar{Y} = r \frac{\sigma_Y}{\sigma_X} (X - \bar{X})\)
In our case, Y is Sales (\(S\)) and X is Advertisement Expenditure (\(A\)). So, the equation for the regression line of \(S\) on \(A\) is:
\(S - \bar{S} = r \frac{\sigma_S}{\sigma_A} (A - \bar{A})\)
Calculating the Regression Coefficients
First, let's calculate the slope of the regression line of \(S\) on \(A\), denoted as \(b_{SA}\):
\(b_{SA} = r \frac{\sigma_S}{\sigma_A}\)
Substitute the given values:
\(b_{SA} = 0.9 \times \frac{10}{1.5}\)
To simplify the calculation:
\(b_{SA} = 0.9 \times \frac{100}{15} = \frac{9}{10} \times \frac{100}{15} = \frac{9 \times 10}{15} = \frac{90}{15}\)
\(b_{SA} = 6\)
Now, we can write the complete regression equation of \(S\) on \(A\):
\(S - \bar{S} = b_{SA} (A - \bar{A})\)
Substitute the means (\(\bar{S}=40\), \(\bar{A}=6\)) and the calculated slope (\(b_{SA}=6\)):
\(S - 40 = 6 (A - 6)\)
Predicting Sales for Rs. 10 Crore Advertisement
We need to find the likely sales (\(S\)) when the advertisement expenditure (\(A\)) is Rs. 10 crore. Substitute \(A = 10\) into the regression equation:
\(S - 40 = 6 (10 - 6)\)
\(S - 40 = 6 (4)\)
\(S - 40 = 24\)
Now, solve for \(S\):
\(S = 24 + 40\)
\(S = 64\)
So, the likely sales for a proposed advertisement expenditure of Rs. 10 crore is Rs. 64 crores.
Final Answer Derivation
Based on the linear regression analysis using the given data, the predicted sales figure is Rs. 64 crores.
Revision Table: Sales and Advertisement Regression
| Concept | Description |
|---|---|
| Linear Regression | Statistical method to model the relationship between two variables by fitting a linear equation to observed data. |
| Correlation Coefficient (r) | Measures the strength and direction of the linear relationship between two variables. Values range from -1 to +1. |
| Regression Line of Y on X | Used to predict the value of Y based on a given value of X. Equation: \(Y - \bar{Y} = r \frac{\sigma_Y}{\sigma_X} (X - \bar{X})\). |
| Slope (b) | Represents the expected change in Y for a one-unit change in X. For Y on X, \(b_{YX} = r \frac{\sigma_Y}{\sigma_X}\). |
Additional Information on Regression Analysis
Regression analysis is a powerful statistical tool used in various fields, including business and economics, to understand how variables relate to each other. In this problem, we used simple linear regression because we were analyzing the relationship between two variables: sales and advertisement expenditure. There are other types of regression, such as multiple linear regression (involving more than one independent variable) and non-linear regression.
The correlation coefficient (\(r\)) tells us about the strength and direction of the linear association. A value of 0.9 indicates a strong positive linear relationship between advertisement expenditure and sales, meaning that as advertisement expenditure increases, sales tend to increase significantly.
The regression line provides the best linear estimate of the dependent variable (Sales) based on the independent variable (Advertisement Expenditure). The calculated slope of 6 means that, on average, for every one crore of Rs. increase in advertisement expenditure, sales are expected to increase by 6 crore of Rs.
Using the regression equation, we can make predictions within the range of the original data. Extrapolating predictions far outside the original data range (e.g., predicting sales for an advertisement expenditure of Rs. 100 crore based on data with maximum expenditure around Rs. 6 crore) might not be reliable as the relationship might not remain linear.
Similar Questions
If a constant 60 is subtracted from each of the values of X and Y, then the regression coefficient is
Given the regression lines X + 2Y - 5 = 0, 2X + 3Y - 8 = 0 and Var(X) = 12, the value of Var(Y) is
The standard deviation of Y is double of standard deviation of x. The correlation coefficient between X and Y is 0.5.
The acute angle between lines of regression is
For the variables X, Y and Z, r xy = 0.80, r xz = 0.64, and r yz = 0.79, the square of multiple correlation coefficient \(\rm \mathop R\nolimits_{xyz}^2 \) is:
If x and y are uncorrelated variables then this implies:
For a bivariate data set on (x, y), if the means, standard deviations and correlation coefficient are
x̅ = 1.0, y̅ = 2.0, s x= 3.0, s y= 9.0, r = 0.8
Then the regression line of y on x is:
Important Questions from Regression Analysis
There is no value of x that can simultaneously satisfy both the given equations. Therefore, find the ‘least squares error’ solution to the two equations, i.e., find the value of x that minimizes the sum of squares of the errors in the two equations. __________
2x = 3
4x = 1
- Using linear regression (least squares), the best-fit line for the given dataset is $y = 2.2x + 2.3$. Given the residual sum of squares is 25.8, the coefficient of determination ($r^2$), is ______________ . (rounded off to two decimal places)
$x$ 2 3 4 5 $y$ 8 9 7 16 - Given the pairs of values of $(X, Y)$ as $(2, 60)$, $(4, 70)$ and $(6, 90)$, $m$ is the slope of the linear regression plot of $Y$ on $X$. The value of $m$ is _______.
- The data given in the table are fitted to the equation $y = mx$ using the method of least squares. The value of $m$ is ______ (rounded off to one decimal place).
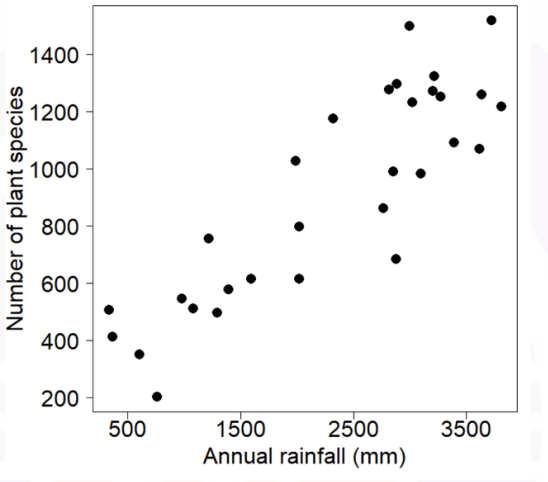
$x$ 1 2 3 4 $y$ 2 6 7 10 The graph below shows a plot of annual rainfall on the X axis and number of plant species on the Y axis. Based on the pattern in the graph, which one of the following statistical methods would be most appropriate to model the relationship between annual rainfall and the number of plant species?