
The graph below shows a plot of annual rainfall on the X axis and number of plant species on the Y axis. Based on the pattern in the graph, which one of the following statistical methods would be most appropriate to model the relationship between annual rainfall and the number of plant species?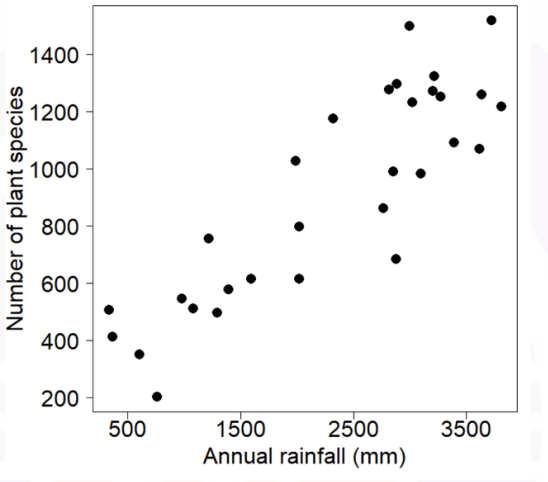
To determine the most appropriate statistical method to model the relationship between annual rainfall and the number of plant species, we need to consider the patterns shown in the graph.
- The graph displays a scatter plot where the X-axis represents annual rainfall and the Y-axis represents the number of plant species.
- The pattern in the graph shows a clear increasing trend, indicating that as the annual rainfall increases, the number of plant species tends to increase linearly.
- The most appropriate statistical method to model a linear relationship between two continuous variables (in this case, annual rainfall and number of plant species) is Linear Regression.
Explanation of why other options are incorrect:
- Kruskal-Wallis test: This is a non-parametric method used to compare more than two groups, not suitable for modeling relationships.
- Student’s t-test: Used to compare the means of two groups, but not for modeling relationships between continuous variables.
- Chi-squared test: Used for categorical data to test the association between variables, not applicable to continuous data shown in this graph.
Thus, the correct choice is Linear Regression.
Important Questions from Regression Analysis
Dimension reduction methods have the goal of using the correlation structure among the predictor variables to accomplish which of the following:
A. To reduce the number of predictor components
B. To help ensure that these components are dependent
C. To provide a framework for interpretability of the results
D. To help ensure that these components are independent
E. To increase the number of predictor components
Choose the correct answer from the options given below:
There is no value of x that can simultaneously satisfy both the given equations. Therefore, find the ‘least squares error’ solution to the two equations, i.e., find the value of x that minimizes the sum of squares of the errors in the two equations. __________
2x = 3
4x = 1
If a constant 60 is subtracted from each of the values of X and Y, then the regression coefficient is
Given the regression lines X + 2Y - 5 = 0, 2X + 3Y - 8 = 0 and Var(X) = 12, the value of Var(Y) is
The data about the sales and advertisement expenditure of a firm is given below
Sales (in crore of Rs.) Advertisement exp (in crores of Rs.) Means 40 6 Standard Daviation 10 1.5
The correlation coefficient between sales and advertisement expenditure is 0.9. The likely sales for a proposed advertisement expenditure of Rs. 10 crore


