
$x$ 1 2 3 4 $y$ 2 6 7 10
Least Squares Fitting
The problem requires fitting the given data to the linear equation $y = mx$ using the method of least squares to find the value of the slope, $m$.
Data Table Analysis
The provided data points $(x_i, y_i)$ are:
| $x$ | $y$ |
|---|---|
| 1 | 2 |
| 2 | 6 |
| 3 | 7 |
| 4 | 10 |
Summation Calculations
To apply the least squares method for the equation $y = mx$, we need the following sums:
- Sum of $x$ values: $\sum x_i = 1 + 2 + 3 + 4 = 10$
- Sum of $x^2$ values: $\sum x_i^2 = 1^2 + 2^2 + 3^2 + 4^2 = 1 + 4 + 9 + 16 = 30$
- Sum of $x \cdot y$ values: $\sum x_i y_i = (1 \times 2) + (2 \times 6) + (3 \times 7) + (4 \times 10) = 2 + 12 + 21 + 40 = 75$
Slope Calculation Formula
The formula for the slope $m$ in the least squares fit for $y = mx$ is:
$m = \frac{\sum x_i y_i}{\sum x_i^2}$Calculating Slope 'm'
Substitute the calculated sums into the formula:
$m = \frac{75}{30}$ $m = 2.5$Final Result Presentation
The calculated value of $m$ is $2.5$. The question asks for the value rounded off to one decimal place. The value $2.5$ is already precise to one decimal place.
Therefore, the value of $m$ is 2.5.
Important Questions from Regression Analysis
There is no value of x that can simultaneously satisfy both the given equations. Therefore, find the ‘least squares error’ solution to the two equations, i.e., find the value of x that minimizes the sum of squares of the errors in the two equations. __________
2x = 3
4x = 1
- Using linear regression (least squares), the best-fit line for the given dataset is $y = 2.2x + 2.3$. Given the residual sum of squares is 25.8, the coefficient of determination ($r^2$), is ______________ . (rounded off to two decimal places)
$x$ 2 3 4 5 $y$ 8 9 7 16 - Given the pairs of values of $(X, Y)$ as $(2, 60)$, $(4, 70)$ and $(6, 90)$, $m$ is the slope of the linear regression plot of $Y$ on $X$. The value of $m$ is _______.
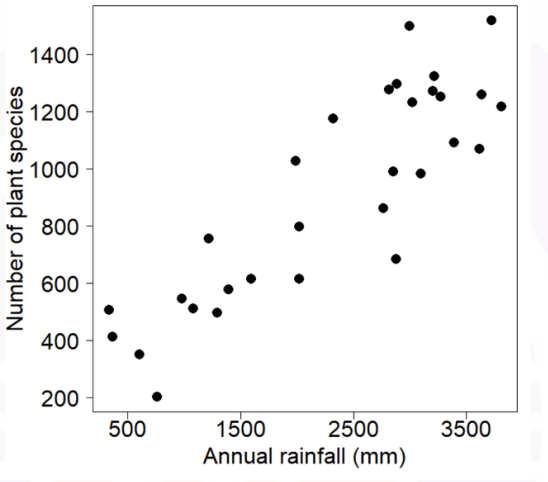
The graph below shows a plot of annual rainfall on the X axis and number of plant species on the Y axis. Based on the pattern in the graph, which one of the following statistical methods would be most appropriate to model the relationship between annual rainfall and the number of plant species?
- Arrange the following steps of formulating research proposal in a logical sequential order :
(i) Defining research problem.
(ii) Formulation of hypothesis.
(iii) Review of literature.
(iv) Collection of data.
(v) Research Design.
Choose the correct answer from the options given below :


