If x and y are uncorrelated variables then this implies:
the absence of any linear relationship between them
Understanding Uncorrelated Variables
The question asks about the implication when two variables, x and y, are described as uncorrelated. In statistics, the term 'uncorrelated' specifically refers to the absence of a linear relationship between the variables.
What is Correlation?
Correlation is a statistical measure that describes the extent to which two variables change together. The most common measure is the Pearson correlation coefficient, denoted by \(r\). This coefficient quantifies the strength and direction of a linear relationship between two continuous variables.
The Pearson correlation coefficient (\(r\)) ranges from -1 to +1:
- \(r = +1\) indicates a perfect positive linear relationship (as x increases, y increases proportionally).
- \(r = -1\) indicates a perfect negative linear relationship (as x increases, y decreases proportionally).
- \(r = 0\) indicates no linear relationship.
Implication of Uncorrelated Variables
When variables x and y are uncorrelated, their Pearson correlation coefficient is 0. This means there is no statistically significant linear association between them. Knowing the value of x does not help in linearly predicting the value of y, and vice versa.
However, it is crucial to understand that 'uncorrelated' only implies the absence of a linear relationship. It does not imply the absence of any relationship. Variables can be uncorrelated but still have a strong non-linear relationship (e.g., quadratic, exponential, etc.).
Analyzing the Options
Let's look at the provided options in light of our understanding:
- Option 1: the absence of any linear relationship between them
This aligns directly with the definition of uncorrelated variables using the Pearson correlation coefficient. A correlation of 0 means no linear relationship. - Option 2: the absence of any quadratic relationship between them
Uncorrelated variables can still have a strong quadratic relationship. For example, if y = x2 and x is symmetrically distributed around 0, the Pearson correlation between x and y would be 0, even though there is a clear quadratic relationship. - Option 3: the absence of any logarithmic relationship between them
Similar to the quadratic relationship, uncorrelated variables can exhibit a logarithmic relationship. - Option 4: the absence of any trigonometric relationship between them
Variables can also be uncorrelated while having a trigonometric relationship (like y = sin(x)).
Therefore, being uncorrelated specifically implies the absence of a linear relationship, not the absence of other types of relationships.
Based on the analysis, the correct statement about uncorrelated variables is that it implies the absence of any linear relationship between them.
| Term | Description | Implication of Uncorrelated (r=0) |
|---|---|---|
| Correlation | Measures the strength and direction of a linear relationship between variables. | Absence of a linear relationship. Does not imply absence of other relationships. |
| Uncorrelated Variables | Variables with a Pearson correlation coefficient of 0. |
Revision Table: Key Concepts
| Concept | Explanation |
|---|---|
| Uncorrelated | Pearson correlation coefficient (\(r\)) is 0. |
| Linear Relationship | Variables change together in a constant proportion (represented by a straight line on a scatter plot). |
| Correlation vs. Causation | Correlation only indicates association, not that one variable causes the other. |
Additional Information: Relationship Types
While correlation specifically measures linear relationships, variables can have various other forms of association:
- Non-linear relationships: These include quadratic (U-shaped or inverted U-shaped), exponential, logarithmic, trigonometric, etc.
- Causal relationships: Where a change in one variable directly causes a change in another. Correlation does not prove causation.
- Spurious relationships: Where variables appear related but the connection is due to a third, unseen variable or pure chance.
Understanding that 'uncorrelated' is limited to the linear sense is crucial in statistical analysis to avoid misinterpretations of data.
Similar Questions
If a constant 60 is subtracted from each of the values of X and Y, then the regression coefficient is
Given the regression lines X + 2Y - 5 = 0, 2X + 3Y - 8 = 0 and Var(X) = 12, the value of Var(Y) is
The data about the sales and advertisement expenditure of a firm is given below
Sales (in crore of Rs.) Advertisement exp (in crores of Rs.) Means 40 6 Standard Daviation 10 1.5
The correlation coefficient between sales and advertisement expenditure is 0.9. The likely sales for a proposed advertisement expenditure of Rs. 10 croreThe standard deviation of Y is double of standard deviation of x. The correlation coefficient between X and Y is 0.5.
The acute angle between lines of regression is
For the variables X, Y and Z, r xy = 0.80, r xz = 0.64, and r yz = 0.79, the square of multiple correlation coefficient \(\rm \mathop R\nolimits_{xyz}^2 \) is:
For a bivariate data set on (x, y), if the means, standard deviations and correlation coefficient are
x̅ = 1.0, y̅ = 2.0, s x= 3.0, s y= 9.0, r = 0.8
Then the regression line of y on x is:
Important Questions from Regression Analysis
There is no value of x that can simultaneously satisfy both the given equations. Therefore, find the ‘least squares error’ solution to the two equations, i.e., find the value of x that minimizes the sum of squares of the errors in the two equations. __________
2x = 3
4x = 1
- Using linear regression (least squares), the best-fit line for the given dataset is $y = 2.2x + 2.3$. Given the residual sum of squares is 25.8, the coefficient of determination ($r^2$), is ______________ . (rounded off to two decimal places)
$x$ 2 3 4 5 $y$ 8 9 7 16 - Given the pairs of values of $(X, Y)$ as $(2, 60)$, $(4, 70)$ and $(6, 90)$, $m$ is the slope of the linear regression plot of $Y$ on $X$. The value of $m$ is _______.
- The data given in the table are fitted to the equation $y = mx$ using the method of least squares. The value of $m$ is ______ (rounded off to one decimal place).
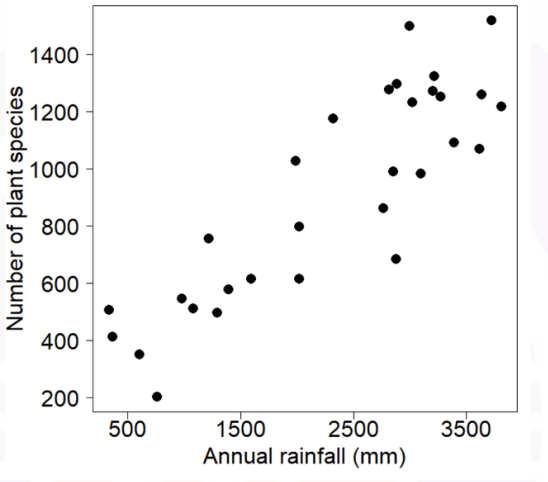
$x$ 1 2 3 4 $y$ 2 6 7 10 The graph below shows a plot of annual rainfall on the X axis and number of plant species on the Y axis. Based on the pattern in the graph, which one of the following statistical methods would be most appropriate to model the relationship between annual rainfall and the number of plant species?