The Northern Plains Of India Is The Most Polluted Region
Relevance: GS3 - Environmental Pollution & Degradation
(Source: The Hindu, 09/04/2023)
Click here for Daily Current Affairs
Why in the news?
Recently, the Air Quality Life Index (AQLI) report for 2023 by the University of Chicago, showed that the world’s 50 most polluted regions belong to the Northern Plains of India.
Table of Contents
Air Pollution in India
- India is the second most polluted nation, all 1.3 billion people live in areas where the annual average particulate pollution level surpasses the WHO guideline.
- The recent report released by University of Chicago said from 1998 to 2021, average annual particulate pollution increased by 67.7%, further reducing average life expectancy by 2.3 years. The most polluted region of the country is “the Northern Plains, where more than a half billion people live”.
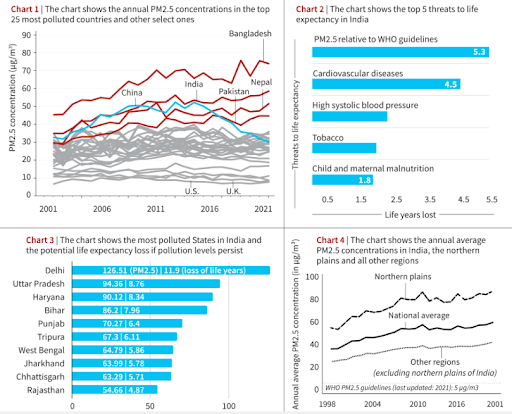
- Delhi’s annual average PM2.5 level in 2021 was found to be 126.5 µg/m3 and the life expectancy of an average person living in the city has shortened by 11.9 years.
- A 2022 study, published in the journal Lancet, found that air pollution caused more than 16.7 lakh premature deaths in India in 2019.
- Out of the total deaths, 9.8 lakh were caused by PM2.5 pollution, and another 6.1 lakh by household air pollution.
Findings of the Recent Report
- AQLI measures the impact of particulate pollution on life expectancy, and the report was released on particulate matter data from 2021 to determine its impact on life expectancy.
- Pollution in Indian States: The report identified Delhi as the most polluted city in India and the world. It identifies the northern plains comprising Bihar, Chandigarh, Delhi, Haryana, Punjab, Uttar Pradesh, and West Bengal as the most polluted region of the country.
- These states/UTs also face the greatest health burden due to particulate pollution in India.
- The report stated that air pollution shortens the lives of the residents of Delhi by around 11.9 years.
- Particulate Matter Pollution: It was stated that particulate matter pollution is the most significant threat to human health in India, reducing life expectancy by 5.3 years, surpassing the impact of cardiovascular diseases (4.5 years) and child/maternal malnutrition (1.8 years).
- Particulate pollution in South Asia surged by 9.7%. Bangladesh, India, Nepal and Pakistan, where 22.9% of the global population lives, are the most polluted countries in the world.
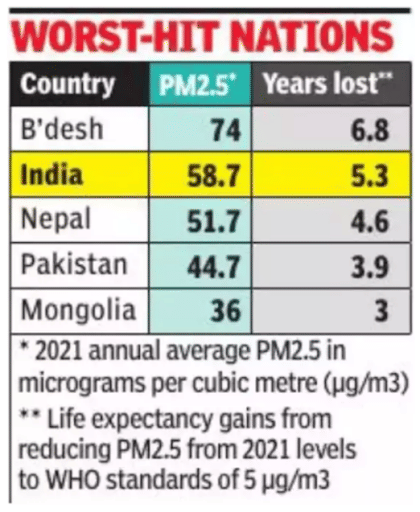
- Life Expectancy: An average Indian citizen loses around 5.3 years of life expectancy due to air pollution.
- While an average citizen in Bangladesh loses 6.8 years of their life to air pollution
- An average Chinese citizen has seen an improvement from 4.7 years of life expectancy being lost in 2013 to 2.5 now, an improvement of 2.2 years.
- Pollution in India: Pollution in India has increased from 56.2 µg/m3 in 2020 to 58.7 µg/m3 in 2021. This is more than 10 times the WHO guideline of 5 µg/m3.
Factors Contributing to Pollution in North India
- Population Concentration: The Northern Plains of India, home to 38.9% of the country's population (521.2 million people), faces severe particulate pollution.
- Pollution Discrepancy: The annual average particulate pollution level in this region is 17.3 times higher than the WHO guideline, indicating a critical environmental issue.
- Industrial Emissions: North India has a significant concentration of industries, including manufacturing, construction, and power generation. These industries release pollutants such as particulate matter (PM), sulfur dioxide (SO2), and nitrogen oxides (NOx) into the atmosphere.
- Stubble Burning: The practice of stubble burning in the neighboring states of Punjab and Haryana, especially during the post-harvest season, leads to the release of large quantities of smoke and pollutants into the air.
- Meteorological Conditions: The geography and meteorological conditions of the region can exacerbate pollution problems. During the winter months, temperature inversions trap pollutants close to the ground, leading to the formation of smog and worsening air quality.
- Lack of Green Cover: Many cities in North India suffer from a lack of green spaces and tree cover. Trees help absorb pollutants and improve air quality.
About AQLI
- Air Quality Life Index (AQLI) is prepared by University of Chicago’s Energy Policy Institute (UCEPI).
- Its purpose is to quantify the causal relationship between long-term human exposure to air pollution and life expectancy.
- The AQLI is rooted in research that quantifies the causal relationship between long-term human exposure to air pollution and life expectancy.
- The index demonstrates that adherence to WHO air quality guidelines or national standards can lead to increased life expectancy.
- This information is valuable for informing both communities and policymakers about the tangible benefits of effective air pollution policies.
Initiatives Taken for Controlling Air Pollution in India
- National Clean Air Programme (NCAP)
- Graded Response Action Plan (GRAP)
- System of Air Quality and Weather Forecasting and Research (SAFAR)
- National Air Quality Index (AQI)
- Push for Electric Vehicles (EVs)
(*Click this link to read prelims specific weekly current affairs articles)
FAQs
Question: What is AQLI?
Answer:
Air Quality Life Index (AQLI) is prepared by University of Chicago’s Energy Policy Institute (UCEPI). Its purpose is to quantify the causal relationship between long-term human exposure to air pollution and life expectancy.
Question: What is Air Pollution?
Answer:
Air pollution is the contamination of air due to the presence of substances in the atmosphere that are harmful to the health of humans and other living beings, or cause damage to the climate or to materials.
Question: What is Particulate Matter?
Answer:
Particulate matter is the term for particles found in the air, including dust, dirt, soot, smoke, and liquid droplets. Particles can be suspended in the air for long periods of time.
UPSC Mains Practice Question:
|
MCQ
Question: In the cities of our country, which among the following atmospheric gases are normally considered in calculating the value of the Air Quality Index? (UPSC 2016)
- Carbon dioxide
- Carbon monoxide
- Nitrogen dioxide
- Sulphur dioxide
- Methane
Select the correct answer using the code given below:
(a) 1, 2 and 3 only
(b) 2, 3 and 4 only
(c) 1, 4 and 5 only
(d) 1, 2, 3, 4 and 5
Answer: (b) See the Explanation
National Air Quality Index (AQI) is a tool for effective communication of air quality status to people in terms which are easy to understand. It transforms complex air quality data of various pollutants into a single number (index value), nomenclature and colour. There are six AQI categories, namely Good, Satisfactory, Moderately Polluted, Poor, Very Poor, and Severe. It considers eight pollutants namely:
- Carbon Monoxide (CO), Nitrogen Dioxide (NO2), Sulphur Dioxide (SO2), Ozone (O3), PM 2.5, PM 10, Ammonia (NH3), Lead (Pb).
Therefore, option (b) is the correct answer.
Download the PREPP App and attempt FREE IAS Exam Mock Tests and get complete study material!

Full Test - 04: UPSC CSE Prelims CSAT (Paper-II)
Full Test - 03: UPSC CSE Prelims CSAT (Paper-II)
UPSC CSE Prelims 2026 GS Paper 1 Question Paper (24-May-2026)
UPSC CSE Prelims 2026 CSAT Paper 2 Question Paper (24-May-2026)

17 February 2025 | The Hindu Must Read Articles | Current Affairs

16 February 2026 | The Hindu Must Read Articles | Current Affairs

13 February 2026 | The Hindu Must Read Articles | Current Affairs









Comments