
Which of the following is a method of collection of primary data?
All of the options
Understanding Primary Data Collection Methods
When researchers gather information directly from the source for a specific study, this information is called primary data. Unlike secondary data, which is collected from existing published or unpublished sources, primary data is original and collected for the first time. There are several methods used to collect this kind of data, each with its own approach.
Exploring Different Primary Data Collection Methods
Let's look at the methods mentioned in the options and understand how they contribute to collecting primary data:
- Direct Personal Interview: In this method, the investigator has direct face-to-face contact with the person from whom the data is to be collected (the respondent). The investigator asks questions and records the answers. This allows for clarification of doubts and observing the respondent's reactions. Since the data is gathered directly from the individual for the study, it is a primary method.
- Indirect Personal Interview: This method is used when it's not possible to interview the person directly (e.g., the person is unwilling or unavailable). Instead, the investigator interviews third parties who are believed to have the necessary information about the person or situation under study. While indirect, the data collected from these third parties is still original information gathered for the current investigation, making it a primary method from the perspective of the researcher.
- Schedules Through Enumerators: In this method, a questionnaire (often called a schedule when used this way) is prepared. Trained enumerators (investigators) take the schedule to the respondents, ask them the questions, and fill in the answers themselves. This is different from sending questionnaires by mail where respondents fill them out themselves. Since trained personnel are collecting data directly from the source using a structured tool for the first time for the study, this is also a method of primary data collection.
Why All Options Represent Primary Data Collection
Each of the methods listed involves the collection of fresh data directly from the source or closely related knowledgeable sources specifically for the purpose of the ongoing research.
- Direct Personal Interview involves direct interaction with the subject.
- Indirect Personal Interview gathers original information about the subject from related knowledgeable sources.
- Schedules through Enumerators uses trained collectors to obtain information directly from respondents.
Therefore, all three methods are well-established techniques for gathering primary data in research and surveys.
| Method | Description | Primary Data? |
|---|---|---|
| Direct Personal Interview | Face-to-face questions with respondent. | Yes |
| Indirect Personal Interview | Questions asked to third parties knowledgeable about the respondent/subject. | Yes |
| Schedules Through Enumerators | Trained enumerators ask questions from a schedule and fill answers. | Yes |
Revision Table: Primary Data Collection Overview
| Concept | Key Point |
|---|---|
| Primary Data | Original data collected for the first time for a specific research purpose. |
| Purpose of Primary Data | To address specific research questions directly, often when secondary data is insufficient or unavailable. |
| Key Methods | Interviews (Direct, Indirect), Questionnaires (Mailed), Schedules (through Enumerators), Observation, Experiments. |
| Advantage | Specific to researcher's needs, higher control over data quality. |
| Disadvantage | Time-consuming, costly, requires significant effort. |
Additional Information on Data Collection
Understanding the difference between primary and secondary data is fundamental in statistics and research.
Primary Data:
- Collected by the investigator for the first time for a specific purpose.
- Original in character.
- Requires significant resources (time, money, effort).
- Examples: Data collected through surveys, interviews, experiments conducted by the researcher.
Secondary Data:
- Data that has been collected by someone else for some other purpose and is available for the current study.
- Already exists; not original for the current study.
- Less resource-intensive than primary data collection.
- Examples: Data from government publications, books, journals, websites, reports already published.
Choosing the right data collection method depends on the research objectives, available resources, time constraints, and the nature of the information required. For accurate and relevant findings, especially when current, specific information is needed, primary data collection methods like interviews and schedules are essential.
Similar Questions
Following histogram shows certain frequency distribution against class intervals.
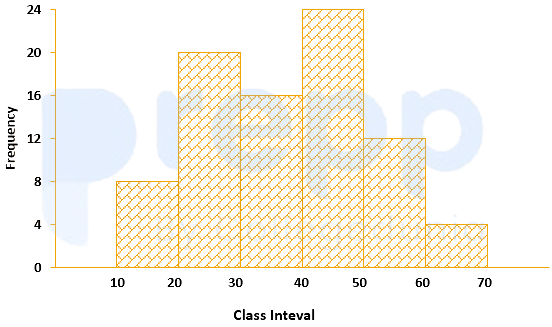
The approximated mean of this distribution is:
The annual vehicles production (in lacs) in india is given in the pie chart.
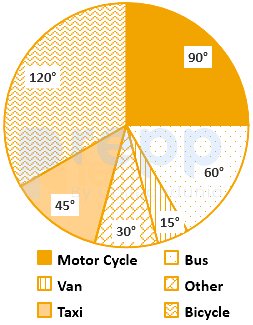
If the annual production of motor cycle is 1.80 lacs, the annual production of Bicycle is
For determination of mode and median graphically, one considers:
The curve obtained by joining the points, whose x-coordinates are the upper limits of the class interval and y-coordinates are corresponding cumulative frequencies is called:
The variation among the observations of each specific class is known as:
For making frequency distribution, the number of classes used depends upon:
When the collected data is grouped with reference to time, we have
Mutual and unique variances among multiple factors can be embodied in a diagram that comprises overlapping circles. The diagram is known as:
The grouped data for the observation are
Class: 1-3 3-5 5-7 Frequency: 2 1 2 The population skewness
Which one is not basis of classification of data?
Important Questions from Classification of Data
The class marks in a frequency table are given to be 5, 10, 15, 20, 25, 30, 35, 40, 45, 50. The class limits of the first five classes are
In a test in Mathematics, 20% of the students obtained “first class”. If the data are represented by a Pie-Chart, what is the central angle corresponding to “first class”?
The following table gives the monthly expenditure of two families:
Expenditure (in Rs.)
Items
Family A
Family B
Food
3,500
2,700
Clothing
500
800
Rent
1,500
1,000
Education
2,000
1,800
Miscellaneous
2,500
1,800
In constructing a pie diagram to the above data, the radii of the circles are to be chosen by which one of the following ratios?
In an examination, 40% of candidates got second class. When the data are represented by a pie chart, what is the angle corresponding to second class?
Following histogram shows certain frequency distribution against class intervals.
The approximated mean of this distribution is:



