
When the collected data is grouped with reference to time, we have
Chronological classifications
Understanding Data Classification by Time
Data classification is a fundamental step in statistics. It involves arranging collected data into different groups, classes, or sections based on certain characteristics or attributes. This process makes the data more organized, concise, and easier to understand and analyze. Various methods are used to classify data, depending on the nature of the information collected and the purpose of the analysis.
Types of Data Classification Methods
When collected data is organized, it can be grouped based on different criteria. Let's look at the common types of classification:
- Quantitative Classification: Data is classified based on characteristics that can be measured and expressed numerically. Examples include height, weight, income, age, production units, etc. The data is grouped into classes based on ranges of these numerical values.
- Qualitative Classification: Data is classified based on attributes or non-measurable characteristics. Examples include gender, religion, nationality, marital status, colour, etc. These characteristics cannot be measured numerically but can be described.
- Geographical Classification: Data is classified based on location or geographical region. This could be grouping data by country, state, city, district, village, etc.
- Chronological Classification: Data is classified based on the time of occurrence. This involves arranging data in chronological order, such as by years, quarters, months, weeks, days, or even hours. This method is used to study trends over time.
Analyzing the Question: Grouping Data by Time
The question specifically asks about the classification method used when collected data is grouped with reference to time. Based on the definitions above:
- Quantitative classification is based on measurable numbers.
- Qualitative classification is based on non-measurable attributes.
- Geographical classification is based on location.
- Chronological classification is based on time.
Therefore, grouping data with reference to time directly corresponds to Chronological classification.
Comparison of Classification Types
Here is a table summarizing the different types of classification:
| Type of Classification | Basis of Grouping | Examples |
|---|---|---|
| Quantitative | Measurable characteristics (Numbers) | Income groups, Height ranges, Marks obtained |
| Qualitative | Attributes (Non-measurable) | Gender, Religion, Marital Status |
| Geographical | Location | Data by country, State, City |
| Chronological | Time | Sales figures per year, Population growth per decade, Temperature per hour |
Conclusion on Data Classification
When data collection results in information that needs to be organized to show changes or patterns over time, Chronological classification is the appropriate method. This allows for the analysis of trends, seasonality, and other time-dependent factors.
Revision Table: Data Classification
| Classification Type | Key Feature |
|---|---|
| Quantitative | Numerical measurement |
| Qualitative | Attributes/Qualities |
| Geographical | Location/Area |
| Chronological | Time periods |
Additional Information: Importance of Data Classification
Proper data classification is crucial for several reasons:
- It simplifies complex data, making it easier to understand.
- It facilitates comparison between different sets of data or between different groups within the same data set.
- It helps in identifying patterns, trends, and relationships within the data.
- It is the necessary first step before data tabulation and statistical analysis.
- It saves time and effort in further processing and interpretation of data.
Choosing the right method of classification depends entirely on the objectives of the statistical study and the characteristics of the data collected.
Similar Questions
Following histogram shows certain frequency distribution against class intervals.
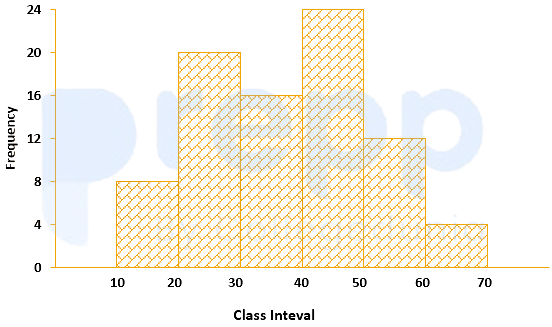
The approximated mean of this distribution is:
The annual vehicles production (in lacs) in india is given in the pie chart.
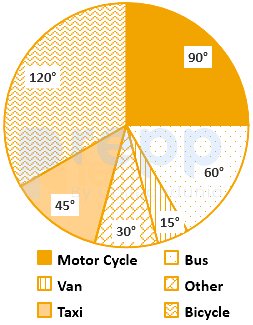
If the annual production of motor cycle is 1.80 lacs, the annual production of Bicycle is
For determination of mode and median graphically, one considers:
The curve obtained by joining the points, whose x-coordinates are the upper limits of the class interval and y-coordinates are corresponding cumulative frequencies is called:
The variation among the observations of each specific class is known as:
For making frequency distribution, the number of classes used depends upon:
Mutual and unique variances among multiple factors can be embodied in a diagram that comprises overlapping circles. The diagram is known as:
The graphical representation of the time series is known as:
Which of the following is a method of collection of primary data?
For a frequency distribution of a discrete variable, the diagram of less than type cumulative frequency is a
Important Questions from Classification of Data
The class marks in a frequency table are given to be 5, 10, 15, 20, 25, 30, 35, 40, 45, 50. The class limits of the first five classes are
In a test in Mathematics, 20% of the students obtained “first class”. If the data are represented by a Pie-Chart, what is the central angle corresponding to “first class”?
The following table gives the monthly expenditure of two families:
Expenditure (in Rs.)
Items
Family A
Family B
Food
3,500
2,700
Clothing
500
800
Rent
1,500
1,000
Education
2,000
1,800
Miscellaneous
2,500
1,800
In constructing a pie diagram to the above data, the radii of the circles are to be chosen by which one of the following ratios?
In an examination, 40% of candidates got second class. When the data are represented by a pie chart, what is the angle corresponding to second class?
Following histogram shows certain frequency distribution against class intervals.
The approximated mean of this distribution is:



