
The curve obtained by joining the points, whose x-coordinates are the upper limits of the class interval and y-coordinates are corresponding cumulative frequencies is called:
Ogive
An Ogive is a cumulative frequency curve obtained by plotting class limits on the x-axis against cumulative frequencies on the y-axis and joining the points. When upper class limits are used, the result is the less-than ogive; lower limits give the more-than ogive.
A histogram uses class intervals as bars with frequencies (not cumulative). A frequency polygon joins class mid-points against frequencies. A pie chart shows proportions of a whole, not class-wise cumulative frequencies. Hence the correct answer is Ogive.
Similar Questions
Following histogram shows certain frequency distribution against class intervals.
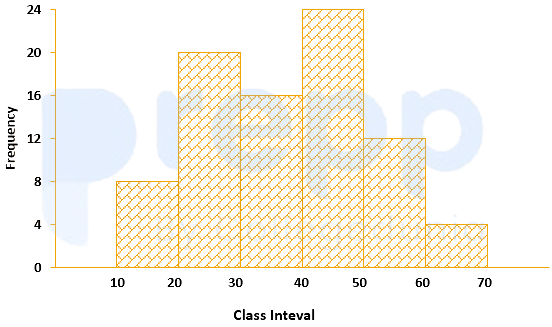
The approximated mean of this distribution is:
The annual vehicles production (in lacs) in india is given in the pie chart.
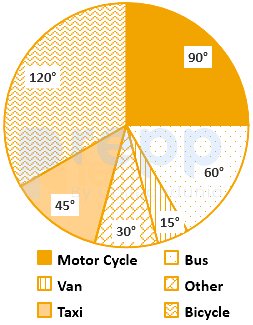
If the annual production of motor cycle is 1.80 lacs, the annual production of Bicycle is
For determination of mode and median graphically, one considers:
The variation among the observations of each specific class is known as:
For making frequency distribution, the number of classes used depends upon:
When the collected data is grouped with reference to time, we have
Mutual and unique variances among multiple factors can be embodied in a diagram that comprises overlapping circles. The diagram is known as:
Which of the following is a method of collection of primary data?
The grouped data for the observation are
Class: 1-3 3-5 5-7 Frequency: 2 1 2 The population skewness
Which one is not basis of classification of data?
Important Questions from Classification of Data
The class marks in a frequency table are given to be 5, 10, 15, 20, 25, 30, 35, 40, 45, 50. The class limits of the first five classes are
In a test in Mathematics, 20% of the students obtained “first class”. If the data are represented by a Pie-Chart, what is the central angle corresponding to “first class”?
The following table gives the monthly expenditure of two families:
Expenditure (in Rs.)
Items
Family A
Family B
Food
3,500
2,700
Clothing
500
800
Rent
1,500
1,000
Education
2,000
1,800
Miscellaneous
2,500
1,800
In constructing a pie diagram to the above data, the radii of the circles are to be chosen by which one of the following ratios?
In an examination, 40% of candidates got second class. When the data are represented by a pie chart, what is the angle corresponding to second class?
Following histogram shows certain frequency distribution against class intervals.
The approximated mean of this distribution is:



