
In a 3 races, 2 genders and 5 in each treatment group for two-way ANOVA, the degree of freedom for source of variation due to interaction, error and total respective are
Calculating Degrees of Freedom in Two-Way ANOVA
Understanding degrees of freedom (DF) is crucial for performing and interpreting Analysis of Variance (ANOVA). In a two-way ANOVA, we examine the effect of two independent factors and their interaction on a dependent variable. The degrees of freedom represent the number of values in the final calculation of a statistic that are free to vary.
For this problem, we have a two-way ANOVA with the following setup:
- Factor A: Races (3 levels)
- Factor B: Genders (2 levels)
- Number of individuals per treatment group: 5
Let's denote:
- Number of levels for Factor A (Races) as \(a = 3\)
- Number of levels for Factor B (Genders) as \(b = 2\)
- Number of replications per group as \(n = 5\)
- Total number of observations as \(N = a \times b \times n\)
First, calculate the total number of observations:
\(N = 3 \times 2 \times 5 = 30\)
Now, let's calculate the degrees of freedom for each source of variation commonly found in a two-way ANOVA table. The question specifically asks for the degrees of freedom for Interaction, Error, and Total.
Degrees of Freedom Calculations for Two-Way ANOVA
Here are the formulas for the required degrees of freedom:
- Degrees of Freedom for Factor A (Races): \(DF_{A} = a - 1\)
- Degrees of Freedom for Factor B (Genders): \(DF_{B} = b - 1\)
- Degrees of Freedom for Interaction (Races x Genders): \(DF_{A \times B} = (a - 1) \times (b - 1)\)
- Degrees of Freedom for Error: \(DF_{Error} = N - (a \times b)\) OR \(DF_{Error} = a \times b \times (n - 1)\)
- Degrees of Freedom for Total: \(DF_{Total} = N - 1\)
Step-by-Step Calculation of Degrees of Freedom
Using the values \(a=3\), \(b=2\), \(n=5\), and \(N=30\):
- Interaction Degrees of Freedom: \(DF_{Interaction} = (a - 1) \times (b - 1) = (3 - 1) \times (2 - 1) = 2 \times 1 = 2\)
- Error Degrees of Freedom: Using the formula \(DF_{Error} = N - (a \times b)\): \(DF_{Error} = 30 - (3 \times 2) = 30 - 6 = 24\) Alternatively, using the formula \(DF_{Error} = a \times b \times (n - 1)\): \(DF_{Error} = 3 \times 2 \times (5 - 1) = 6 \times 4 = 24\)
- Total Degrees of Freedom: \(DF_{Total} = N - 1 = 30 - 1 = 29\)
The question asks for the degrees of freedom for source of variation due to interaction, error, and total respectively. These are 2, 24, and 29.
Summary of Degrees of Freedom
| Source of Variation | Formula | Calculation | Degrees of Freedom (DF) |
|---|---|---|---|
| Factor A (Races) | \(a - 1\) | \(3 - 1\) | 2 |
| Factor B (Genders) | \(b - 1\) | \(2 - 1\) | 1 |
| Interaction (A x B) | \((a - 1)(b - 1)\) | \((3 - 1)(2 - 1)\) | 2 |
| Error | \(a \times b \times (n - 1)\) | \(3 \times 2 \times (5 - 1)\) | 24 |
| Total | \(N - 1\) | \(30 - 1\) | 29 |
The degrees of freedom for Interaction, Error, and Total are 2, 24, and 29, respectively.
Revision Table: Two-Way ANOVA Degrees of Freedom
| Term | Description | Degrees of Freedom Formula |
|---|---|---|
| Factor A | The first independent variable (e.g., Races) | \(a - 1\) |
| Factor B | The second independent variable (e.g., Genders) | \(b - 1\) |
| Interaction (A x B) | The combined effect of Factor A and Factor B | \((a - 1)(b - 1)\) |
| Error | Variability within each group not explained by the factors | \(a \times b \times (n - 1)\) |
| Total | Overall variability in the data | \(N - 1\) |
Additional Information: Understanding Degrees of Freedom
Degrees of freedom relate to the sample size and the number of parameters being estimated. In ANOVA, DF are associated with the sum of squares for each source of variation. The total DF is partitioned among the main effects, interaction, and error. The Error DF is often considered the degrees of freedom associated with the estimate of the population variance (\(\sigma^2\)). A higher error DF generally leads to a more precise estimate of variance. The DF for main effects and interaction are related to the number of levels for each factor.
In a balanced two-way ANOVA (where each cell has the same number of observations), the sum of the DFs for Factor A, Factor B, Interaction, and Error equals the Total DF:
\(DF_{A} + DF_{B} + DF_{A \times B} + DF_{Error} = (a - 1) + (b - 1) + (a - 1)(b - 1) + a \times b \times (n - 1)\)
Let's check with our example:
\(2 + 1 + 2 + 24 = 29\)
This sum equals the Total DF (\(N - 1 = 29\)), confirming the calculations are correct for this two-way ANOVA setup.
Similar Questions
In a two-way ANOVA table
Source of Variation Degree of Freedom Sum of square Mean sum of squares F Due to Level A 2 294 147 F A Due to Level B 2 6 3 F B Due to error 4 12 3 Total x 312 the value of x, F A, F Bare:
For the ANOVA, which option is wrong?
For the ANOVA table
Source of variations Sum of squares Degree of freedom Between treatment 75 3 Error 48 16 Total 123 19 the F - statistics is
The Pearson's correlation coefficient between following observation
X: 1 2 3 4 Y: 3 4 2 1 is -0.8. If each observation of X is halved and of Y is doubled, then Pearson's correlation coefficient equals to
For the ANOVA table
Source of variations Sum of squares Degrees of freedom Between treatment 45 3 Error 32 16 Total 99 19 the F - statistics is:
For the ANOVA, which of the following options is INCORRECT?
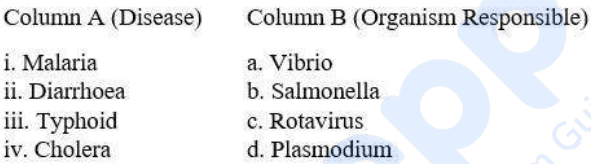
Match the points under Column A with those under Column B.
Important Questions from Measurement and Analysis of Data
Which of the following are not true for ANCOVA ?
A. It uses partial correlation principles.
B. It transforms quasi-experiment into a true experiment.
C. It has two dependent variables.
D. It controls variance at analysis stage.
E. It controls variance at the time of structuring research design.
Choose the correct answer from the options given below:
- The correlation coefficient between scores on two parts of a given test is 0.50. What is the reliability coefficient of the total test?
- What will be the 't value' when 'between-groups variance' and 'within-groups variance' is 200 and 50 respectively ?
For a symmetric distribution, which of the following formula is not correct?
Arrange the steps used in constructing an equal-appearing interval attitude scale:
A. Selection of statements for the final scale
B. Collection and editing of statements
C. Planning for the scale
D. The sorting procedure
E. Establishment of reliability and validity of the scale
Choose the correct answer from the options given below:



