
For the ANOVA, which of the following options is INCORRECT?
F - ratio belongs to [-∞, ∞]
Understanding ANOVA: Identifying the Incorrect Statement
ANOVA, which stands for Analysis of Variance, is a statistical test used to compare the means of three or more independent groups. It determines if there is a statistically significant difference between the means of these groups. The core idea behind ANOVA is to partition the total variability in a dataset into different components attributed to different sources, such as variability between groups and variability within groups.
Let's analyze each given option in the context of ANOVA:
Analyzing ANOVA Hypotheses (Option 1 and 3)
Option 1: Null hypothesis H0 ∶ μ1 = μ2 = ... = μn
In ANOVA, the null hypothesis (\(H_0\)) states that there is no difference between the population means of the groups being compared. If we have \(k\) groups with population means \(\mu_1, \mu_2, \dots, \mu_k\), the null hypothesis is indeed stated as \(\mu_1 = \mu_2 = \dots = \mu_k\). This statement is correct.
Option 3: Alternative hypothesis H1 : At least one population mean is different from one another
The alternative hypothesis (\(H_1\) or \(H_a\)) in ANOVA contradicts the null hypothesis. It states that at least one of the group population means is different from the others. It does not specify which mean is different, just that the null hypothesis is false. This statement is also correct.
Analyzing the ANOVA F-ratio (Option 2 and 4)
The F-ratio is the test statistic used in ANOVA. It is calculated as the ratio of the variance between groups to the variance within groups.
F-ratio = \(\frac{\text{Variance Between Groups}}{\text{Variance Within Groups}}\)
This ratio helps determine if the variability observed between the group means is significantly larger than the variability expected by chance (the variability within the groups).
Option 4: Variance are compared in F ratio to determine mean differences are significantly bigger than chance
As explained above, the F-ratio compares the variability between groups (which reflects differences in means) to the variability within groups (which reflects random chance and individual differences). A large F-ratio suggests that the differences between group means are large relative to the variation within groups, indicating a potential significant difference between the means. This statement accurately describes the purpose of the F-ratio in ANOVA and is correct.
Option 2: F - ratio belongs to [-∞, ∞]
The F-ratio is calculated as a ratio of variances. Variance is a measure of the spread or dispersion of data points, calculated as the average of the squared differences from the mean. Squared values are always non-negative, and therefore, variance is always a non-negative value (\(\ge 0\)). Since the F-ratio is a ratio of two variances (Variance Between Groups / Variance Within Groups), and both are non-negative, the F-ratio itself must be non-negative.
The F-distribution, which is the sampling distribution for the F-ratio under the null hypothesis, is defined for values greater than or equal to 0. The range of the F-ratio is actually \([0, \infty)\), meaning it can be zero or any positive value, but it cannot be negative.
Therefore, stating that the F-ratio belongs to \([-\infty, \infty]\) is incorrect.
Summary of Options
| Option | Statement | Correctness in ANOVA |
|---|---|---|
| 1 | Null hypothesis H0 ∶ μ1 = μ2 = ... = μn | Correct |
| 2 | F - ratio belongs to [-∞, ∞] | Incorrect |
| 3 | Alternative hypothesis H1 : At least one population mean is different from one another | Correct |
| 4 | Variance are compared in F ratio to determine mean differences are significantly bigger than chance | Correct |
Based on the analysis, the incorrect statement about ANOVA is that the F-ratio belongs to the range \([-\infty, \infty]\).
Revision Table: Key ANOVA Concepts
| Concept | Description | Mathematical Notation/Property |
|---|---|---|
| Purpose of ANOVA | To compare means of 3+ groups. | Tests differences among \(\mu_i\). |
| Null Hypothesis (\(H_0\)) | All group means are equal. | \(H_0: \mu_1 = \mu_2 = \dots = \mu_k\) |
| Alternative Hypothesis (\(H_1\)) | At least one group mean is different. | \(H_1: \text{Not all } \mu_i \text{ are equal.}\) |
| F-ratio | Ratio of variance between groups to variance within groups. | \(F = \frac{\text{MS}_{Between}}{\text{MS}_{Within}}\) |
| Range of F-ratio | Cannot be negative. | \([0, \infty)\) |
| F-distribution | Probability distribution for the F-ratio. | Defined for \(F \ge 0\). |
Additional Information on ANOVA and F-distribution
ANOVA is a powerful tool in statistics, widely used in experimental design and data analysis. It allows researchers to test for overall differences among multiple groups simultaneously, which is more efficient than performing multiple pairwise t-tests (which would increase the chance of Type I errors).
The calculation of the F-ratio involves computing sums of squares (SS) and mean squares (MS). Mean Square is essentially variance (SS divided by degrees of freedom).
- Sum of Squares Total (SSTotal): Total variability in the data.
- Sum of Squares Between Groups (SSBetween): Variability explained by differences between group means.
- Sum of Squares Within Groups (SSWithin): Variability within each group, not explained by group membership (often called error variance).
SSTotal = SSBetween + SSWithin
Mean Squares are calculated by dividing the sum of squares by their respective degrees of freedom (df):
- MSBetween = SSBetween / dfBetween
- MSWithin = SSWithin / dfWithin
The F-ratio is then MSBetween / MSWithin. Since both SS and df are non-negative, MSBetween and MSWithin are non-negative variances. Consequently, their ratio, the F-ratio, must be non-negative (\(F \ge 0\)). The F-distribution is a family of distributions parameterized by two degrees of freedom: one for the numerator (dfBetween) and one for the denominator (dfWithin).
Similar Questions
In a two-way ANOVA table
Source of Variation Degree of Freedom Sum of square Mean sum of squares F Due to Level A 2 294 147 F A Due to Level B 2 6 3 F B Due to error 4 12 3 Total x 312 the value of x, F A, F Bare:
For the ANOVA, which option is wrong?
For the ANOVA table
Source of variations Sum of squares Degree of freedom Between treatment 75 3 Error 48 16 Total 123 19 the F - statistics is
In a 3 races, 2 genders and 5 in each treatment group for two-way ANOVA, the degree of freedom for source of variation due to interaction, error and total respective are
The Pearson's correlation coefficient between following observation
X: 1 2 3 4 Y: 3 4 2 1 is -0.8. If each observation of X is halved and of Y is doubled, then Pearson's correlation coefficient equals to
For the ANOVA table
Source of variations Sum of squares Degrees of freedom Between treatment 45 3 Error 32 16 Total 99 19 the F - statistics is:
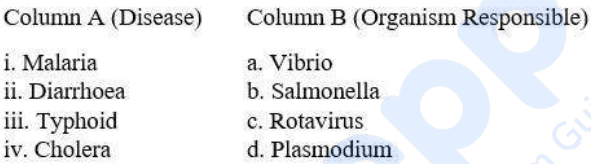
Match the points under Column A with those under Column B.
Important Questions from Measurement and Analysis of Data
Which of the following are not true for ANCOVA ?
A. It uses partial correlation principles.
B. It transforms quasi-experiment into a true experiment.
C. It has two dependent variables.
D. It controls variance at analysis stage.
E. It controls variance at the time of structuring research design.
Choose the correct answer from the options given below:
- The correlation coefficient between scores on two parts of a given test is 0.50. What is the reliability coefficient of the total test?
- What will be the 't value' when 'between-groups variance' and 'within-groups variance' is 200 and 50 respectively ?
For a symmetric distribution, which of the following formula is not correct?
Arrange the steps used in constructing an equal-appearing interval attitude scale:
A. Selection of statements for the final scale
B. Collection and editing of statements
C. Planning for the scale
D. The sorting procedure
E. Establishment of reliability and validity of the scale
Choose the correct answer from the options given below:



