
For the ANOVA, which option is wrong?
Understanding ANOVA and the F-statistic
ANOVA, or Analysis of Variance, is a statistical technique used to compare the means of three or more groups to see if there is a statistically significant difference between them. It works by analyzing the variation within each group and the variation between the groups.
The core idea behind ANOVA is to partition the total variability observed in a dataset into different components attributable to different sources of variation. Key components in ANOVA include:
- Sum of Squares (SS): Measures the total variation. This is broken down into Sum of Squares Between Groups (SSB) and Sum of Squares Within Groups (SSW).
- Degrees of Freedom (df): Related to the number of independent pieces of information used to calculate a statistic. Also partitioned into df_between and df_within.
- Mean Sum of Squares (MS): Calculated by dividing the Sum of Squares by its corresponding degrees of freedom. MSB = SSB / df_between and MSW = SSW / df_within.
- F-statistic: The test statistic used in ANOVA to determine if the differences between group means are statistically significant.
Analyzing the ANOVA Options
Let's examine each given option in the context of standard ANOVA principles to identify the incorrect statement.
Option 1: Total sum of square = Total variation in data
The total sum of squares (SST) measures the overall variation of individual data points from the grand mean of all the data. It represents the total variability present in the dataset. Therefore, this statement is correct.
Option 2: \( \rm F = \frac{Mean\space sum\space of\space square\space within\space group}{Mean\space sum\space of\space square\space between\space group} \)
The F-statistic in ANOVA is calculated as the ratio of the variance between groups to the variance within groups. The Mean Sum of Squares Between Groups (MSB) is an estimate of the variance between the group means, while the Mean Sum of Squares Within Groups (MSW) is an estimate of the variance within the groups. The standard formula for the F-statistic is:
\( \rm F = \frac{Mean\space sum\space of\space square\space between\space group}{Mean\space sum\space of\space square\space within\space group} = \frac{MS_{Between}}{MS_{Within}} \)
This option provides the inverse ratio, placing the Mean Sum of Square Within Group in the numerator and the Mean Sum of Square Between Group in the denominator. This is not the correct formula for the F-statistic used to test for differences between group means in ANOVA. Therefore, this statement is wrong.
Option 3: Total degree of freedom = between degree of freedom + within degree of freedom
The total degrees of freedom (df_total) is equal to the total number of observations minus 1 ($N-1$). The degrees of freedom between groups (df_between) is the number of groups minus 1 ($k-1$), and the degrees of freedom within groups (df_within) is the total number of observations minus the number of groups ($N-k$). It is a fundamental property of ANOVA that the total degrees of freedom is the sum of the between and within degrees of freedom: df_total = df_between + df_within. This statement is correct.
Option 4: Mean sum of square between group \( \rm = \frac{\space sum\space of\space square\space between\space group}{degree\space of\space freedom\space between\space group} \)
The Mean Sum of Squares (MS) is defined as the Sum of Squares (SS) divided by the corresponding degrees of freedom (df). This applies to both between-group and within-group components. The formula for the Mean Sum of Squares Between Groups (MSB) is indeed the Sum of Squares Between Groups (SSB) divided by the Degrees of Freedom Between Groups (df_between). This statement is correct.
Conclusion on ANOVA Statements
Based on the analysis of each statement against standard ANOVA formulas and concepts, the incorrect option is the one providing the formula for the F-statistic with the numerator and denominator swapped compared to the correct formula.
| ANOVA Component | Formula/Relationship | Correct? |
|---|---|---|
| Total Sum of Squares (SST) | Represents total variation | Yes |
| F-statistic | \( \rm F = \frac{MS_{Between}}{MS_{Within}} \) | Option shows inverse formula |
| Total Degrees of Freedom | df_total = df_between + df_within | Yes |
| Mean Sum of Squares Between (MSB) | MSB = SSB / df_between | Yes |
Revision Table: Key ANOVA Concepts
| Term | Definition | Formula/Calculation |
|---|---|---|
| Total Sum of Squares (SST) | Total variation in the data | Sum of squared deviations of each data point from the grand mean |
| Sum of Squares Between Groups (SSB) | Variation between the group means | Sum of squared deviations of each group mean from the grand mean, weighted by group size |
| Sum of Squares Within Groups (SSW) | Variation within each group | Sum of squared deviations of each data point from its group mean |
| Total Degrees of Freedom (df_total) | N - 1 (N = total observations) | df_between + df_within |
| Degrees of Freedom Between Groups (df_between) | k - 1 (k = number of groups) | |
| Degrees of Freedom Within Groups (df_within) | N - k | |
| Mean Sum of Squares Between (MSB) | Variance estimate between groups | SSB / df_between |
| Mean Sum of Squares Within (MSW) | Variance estimate within groups | SSW / df_within |
| F-statistic | Ratio of between-group variance to within-group variance | \( \rm F = \frac{MSB}{MSW} \) |
Additional Information: ANOVA Assumptions and Interpretation
For the results of an ANOVA test to be reliable, certain assumptions about the data should be met:
- Independence: Observations within and between groups must be independent.
- Normality: The data within each group should be approximately normally distributed.
- Homogeneity of Variances: The variance within each group should be approximately equal (homoscedasticity).
The F-statistic calculated in ANOVA is compared to a critical F-value from the F-distribution or used to calculate a p-value. A large F-statistic and a small p-value (typically < 0.05) indicate that there is statistically significant evidence to reject the null hypothesis (which states that all group means are equal) and conclude that at least one group mean is different from the others.
If the ANOVA test is significant, post-hoc tests (like Tukey's HSD, Bonferroni) are often performed to determine which specific group pairs have statistically significant mean differences.
Similar Questions
In a two-way ANOVA table
Source of Variation Degree of Freedom Sum of square Mean sum of squares F Due to Level A 2 294 147 F A Due to Level B 2 6 3 F B Due to error 4 12 3 Total x 312 the value of x, F A, F Bare:
For the ANOVA table
Source of variations Sum of squares Degree of freedom Between treatment 75 3 Error 48 16 Total 123 19 the F - statistics is
In a 3 races, 2 genders and 5 in each treatment group for two-way ANOVA, the degree of freedom for source of variation due to interaction, error and total respective are
The Pearson's correlation coefficient between following observation
X: 1 2 3 4 Y: 3 4 2 1 is -0.8. If each observation of X is halved and of Y is doubled, then Pearson's correlation coefficient equals to
For the ANOVA table
Source of variations Sum of squares Degrees of freedom Between treatment 45 3 Error 32 16 Total 99 19 the F - statistics is:
For the ANOVA, which of the following options is INCORRECT?
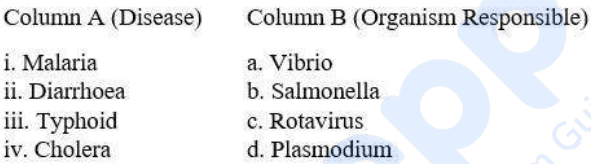
Match the points under Column A with those under Column B.
Important Questions from Measurement and Analysis of Data
Arrange the following researches in an increasing order in terms of generalization of their respective findings:
A. Ethnographic research
B. Survey research
C. Experimental research
D. Action research
E. Case study research
Choose the correct answer from the options given below:
Which of the following are not true for ANCOVA ?
A. It uses partial correlation principles.
B. It transforms quasi-experiment into a true experiment.
C. It has two dependent variables.
D. It controls variance at analysis stage.
E. It controls variance at the time of structuring research design.
Choose the correct answer from the options given below:
- The correlation coefficient between scores on two parts of a given test is 0.50. What is the reliability coefficient of the total test?
- What will be the 't value' when 'between-groups variance' and 'within-groups variance' is 200 and 50 respectively ?
For a symmetric distribution, which of the following formula is not correct?



