Study the following pie chart carefully and answer the questions given below:
The following pie chart gives the information about the distribution of population (in %) of India in different geographical zones :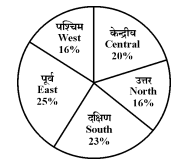
To determine how much percentage less the population of the north zone is compared to the east zone, we must compare the two percentages given in the pie chart data.
Let's assume from the pie chart:
- Population percentage of the East Zone = E%
- Population percentage of the North Zone = N%
The percentage by which the north zone is less than the east zone can be calculated using the formula:
\(\text{Percentage Difference} = \left(\frac{E - N}{E}\right) \times 100\%\)
Given values (as obtained from the context or diagram):
- E = 25% (Assumed percentage of the east zone’s population)
- N = 16% (Assumed percentage of the north zone’s population)
Now insert these values into the formula:
\(\text{Percentage Difference} = \left(\frac{25 - 16}{25}\right) \times 100\%\)
Simplifying:
\(\text{Percentage Difference} = \left(\frac{9}{25}\right) \times 100\% = 36\%\)
Thus, the population of the north zone is 36% less than that of the east zone, which matches the correct option.
Similar Questions
- Find the time taken by train A to pass train C if they are travelling in the same direction.
- Find the approximate time taken by train B and train D to cross each other if both are travelling in opposite direction.
- If train E crosses a platform of certain length in 50 seconds, then find the approximate time taken by train D to cross the same platform.
- Train A was travelling from Patna to Delhi while train D was travelling from Delhi to Patna. Train A started after 2 hours of train D. If both trains meet at a distance of 297 km from Delhi, then find the approximate distance between Patna to Delhi.
- Train B and train C were travelling from station X to station Y which is 414 km apart. If both reached the station Y at the same time then find after how much time (approximately) of train C, would train B leaved station X ?
- If the total population of India is 125 crores, then what is the approximate sum of the population of south zone and that of west zone in crores?
- If the total population of east zone of India is 126.5 million, then what is the approximate total population of north zone of India? (in million)
- In India, the ratio of males to females is 13: 12 and in central zone, the ratio of males to females is 9: 7. The number of females in central zone is what percentage of the total number of females of India?
- 50% of the total population of west zone are males which is equal to 10% of the total population of males in India and if the total population of females in west zone is 50 million, then what is the total population of males in India?
- The selling price of book A in store 1 is ₹395 and difference of selling price in store 2 and 3 is ₹36.825. What is the approx. discount percentage in store 2?
Important Questions from Data Interpetation (Notes)
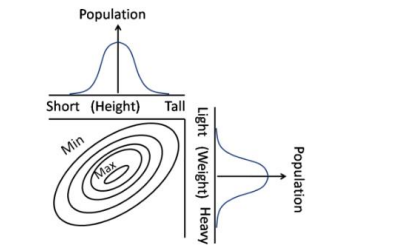
Contours in the bivariate (weight, height) graph connect regions of approximately equal popula-tions. Which of the following interpretations is correct?
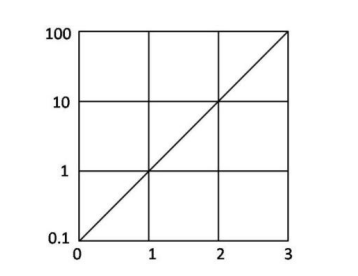
The function $f(x)$ is plotted against $x$ as shown. Extrapolate and find the value of the function at $x = -1$.
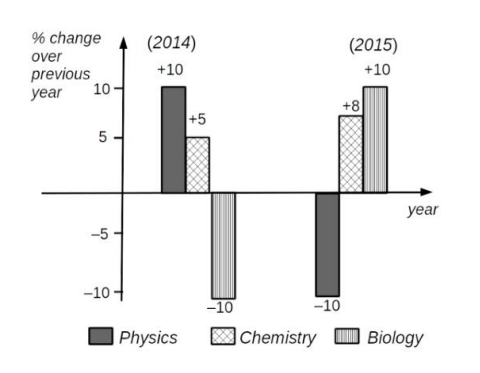
Which of the following inferences can be drawn from the above graph?
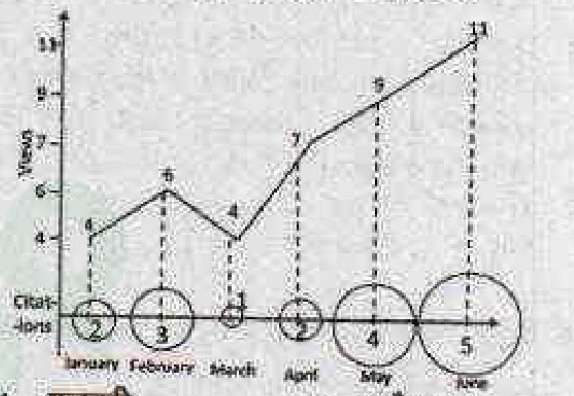
Number of times a research paper is viewed and cited is shown in the plot. In which month was the percentage increase in citation more than the double of the percentage increase in view?
- There are two examinations, A and B in a subject which are evaluated out of 30 and 70 marks, respectively. In order to pass the course the student has to get at least 40 % in total and at least 40 % in B. The following are the marks of the students $S_1$ to $S_4$.
Students A B $S_1$ 12 28 $S_2$ 10 29 $S_3$ 16 27 $S_4$ 05 29
The only student/s to have passed is/are