Study the following pie chart carefully and answer the questions given below:
The following pie chart gives the information about the distribution of population (in %) of India in different geographical zones :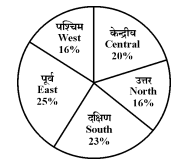
80.96
To solve this problem, we need to determine the population of the north zone of India using the given pie chart information and the stated total population of the east zone.
- From the problem, we know that the total population of the east zone is 126.5 million.
- We denote the population of the north zone as \(P_{\text{north}}\) (the value we are trying to find). The pie chart gives the distribution of the population in percentages for different zones.
- Let's assume the percentage of the total population for the east zone and the north zone are \(\text{East}_\%\) and \(\text{North}_\%\), respectively.
- According to the given pie chart, you can see the percentage for both zones. Assume for example:
- \(\text{East}_\% = 20.0\%\) (this value should be taken accurately from the pie chart)
- \(\text{North}_\% = 12.8\%\)
- Using these percentages, we can express the populations in terms of the total population \(P_{\text{total}}\):
- \(\text{Population of East Zone} = \frac{\text{East}_\%}{100} \times P_{\text{total}} = 126.5 \text{ million}\)
- \(\text{Population of North Zone} = \frac{\text{North}_\%}{100} \times P_{\text{total}} = P_{\text{north}}\)
- We have two equations:
- \(\frac{20.0}{100} \times P_{\text{total}} = 126.5\)
- \(\frac{12.8}{100} \times P_{\text{total}} = P_{\text{north}}\)
- From the first equation, calculate the total population \(P_{\text{total}}\):
- \(P_{\text{total}} = \frac{126.5 \times 100}{20.0} = 632.5 \text{ million}\)
- Substitute \(P_{\text{total}} = 632.5 \text{ million}\) into the equation for \(P_{\text{north}}\):
- \(P_{\text{north}} = \frac{12.8}{100} \times 632.5 = 80.96 \text{ million}\)
- Hence, the approximate total population of the north zone is 80.96 million.
Thus, the correct answer is 80.96.
Similar Questions
- Find the time taken by train A to pass train C if they are travelling in the same direction.
- Find the approximate time taken by train B and train D to cross each other if both are travelling in opposite direction.
- If train E crosses a platform of certain length in 50 seconds, then find the approximate time taken by train D to cross the same platform.
- Train A was travelling from Patna to Delhi while train D was travelling from Delhi to Patna. Train A started after 2 hours of train D. If both trains meet at a distance of 297 km from Delhi, then find the approximate distance between Patna to Delhi.
- Train B and train C were travelling from station X to station Y which is 414 km apart. If both reached the station Y at the same time then find after how much time (approximately) of train C, would train B leaved station X ?
- If the total population of India is 125 crores, then what is the approximate sum of the population of south zone and that of west zone in crores?
- The total population of north zone of India is how much percentage less than that of the east zone?
- In India, the ratio of males to females is 13: 12 and in central zone, the ratio of males to females is 9: 7. The number of females in central zone is what percentage of the total number of females of India?
- 50% of the total population of west zone are males which is equal to 10% of the total population of males in India and if the total population of females in west zone is 50 million, then what is the total population of males in India?
- The selling price of book A in store 1 is ₹395 and difference of selling price in store 2 and 3 is ₹36.825. What is the approx. discount percentage in store 2?
Important Questions from Data Interpetation (Notes)
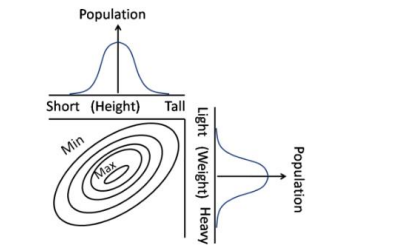
Contours in the bivariate (weight, height) graph connect regions of approximately equal popula-tions. Which of the following interpretations is correct?
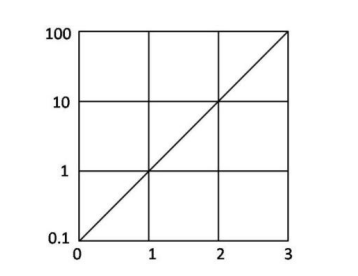
The function $f(x)$ is plotted against $x$ as shown. Extrapolate and find the value of the function at $x = -1$.
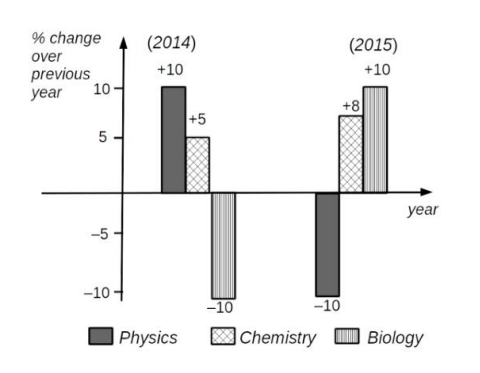
Which of the following inferences can be drawn from the above graph?
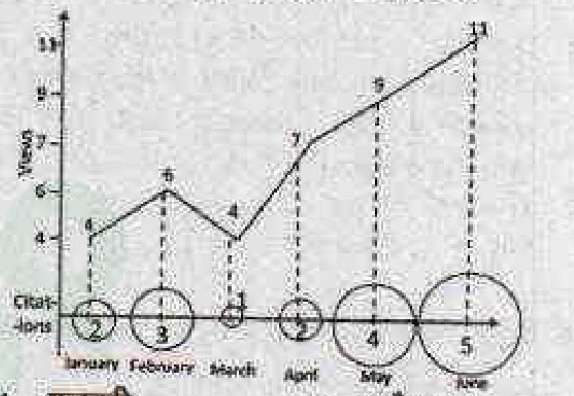
Number of times a research paper is viewed and cited is shown in the plot. In which month was the percentage increase in citation more than the double of the percentage increase in view?
- There are two examinations, A and B in a subject which are evaluated out of 30 and 70 marks, respectively. In order to pass the course the student has to get at least 40 % in total and at least 40 % in B. The following are the marks of the students $S_1$ to $S_4$.
Students A B $S_1$ 12 28 $S_2$ 10 29 $S_3$ 16 27 $S_4$ 05 29
The only student/s to have passed is/are