
The function $f(x)$ is plotted against $x$ as shown. Extrapolate and find the value of the function at $x = -1$.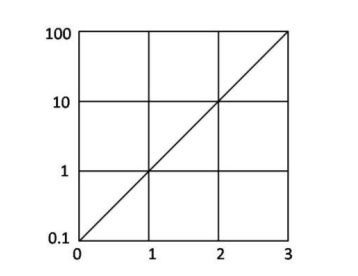
To solve this problem, we need to extrapolate the given function based on the graph shown. The task is to find the value of the function \( f(x) \) at \( x = -1 \).
Let's analyze the graph:
- The graph plots the function \( f(x) \) against \( x \).
- From the visual depiction, it looks like a linear function on a logarithmic scale, where both axes are logs. This suggests an exponential relationship.
- Observing the trend, the function seems to be growing linearly in this logarithmic plot, indicating an exponential increase in the arithmetic scale.
To find \( f(x) \) at \( x = -1 \), we can extend the linear trend back to this value. Based on options and the pattern observed:
- If \( f(x) \) approximately reaches a small positive value near zero, we estimate it would reach around 0.01 when \( x = -1 \) in the arithmetic scale.
Thus, the correct extrapolated value for \( f(x) \) at \( x = -1 \) is 0.01.
The correct answer is 0.01.
Important Questions from Data Interpetation (Notes)
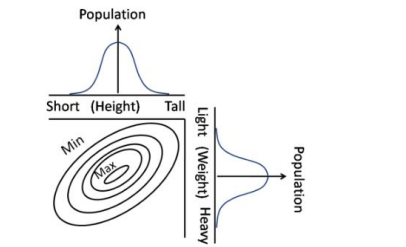
Contours in the bivariate (weight, height) graph connect regions of approximately equal popula-tions. Which of the following interpretations is correct?
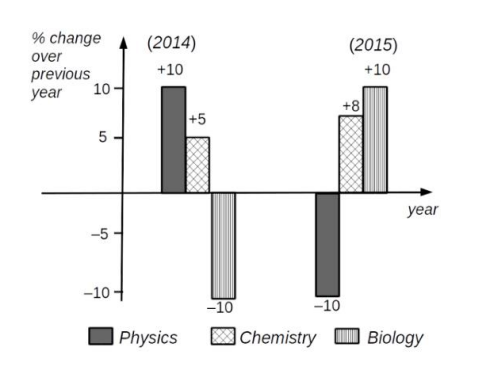
Which of the following inferences can be drawn from the above graph?
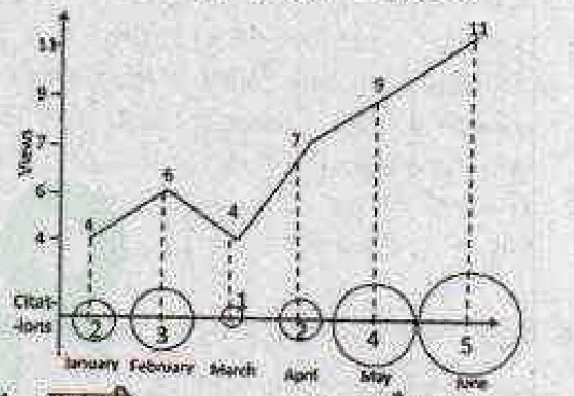
Number of times a research paper is viewed and cited is shown in the plot. In which month was the percentage increase in citation more than the double of the percentage increase in view?
- There are two examinations, A and B in a subject which are evaluated out of 30 and 70 marks, respectively. In order to pass the course the student has to get at least 40 % in total and at least 40 % in B. The following are the marks of the students $S_1$ to $S_4$.
Students A B $S_1$ 12 28 $S_2$ 10 29 $S_3$ 16 27 $S_4$ 05 29
The only student/s to have passed is/are The graph depicts the petrol prices (in Rs. per litre) for the months April, May and June.
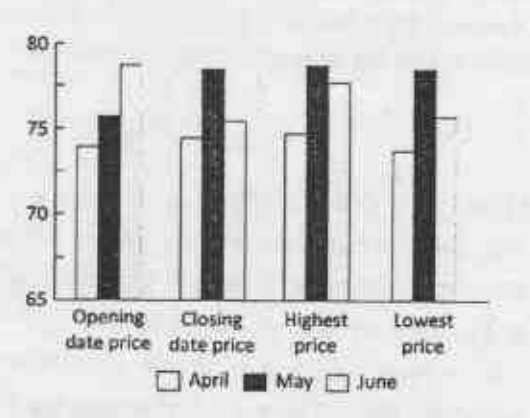
Pick the INCORRECT statement.


