
The graph depicts the petrol prices (in Rs. per litre) for the months April, May and June. 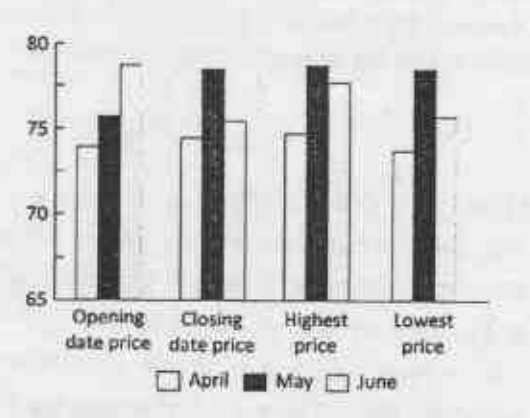
Pick the INCORRECT statement.
To solve this question, we need to analyze the given graph depicting the petrol prices for the months of April, May, and June. Let's examine each statement to determine which is incorrect.
- Check if "The highest price never crossed 75":
- From the graph, it is evident that the highest price during May and June crosses 75. Therefore, this statement is incorrect.
- Check if "The largest difference between the highest and lowest price was for the month of June":
- From the graph:
- April: Highest ~77, Lowest ~67. Difference = 10.
- May: Highest ~78, Lowest ~71. Difference = 7.
- June: Highest ~79, Lowest ~68. Difference = 11.
- From the graph:
- Check if "Month of June showed the largest decrease of price between the opening date and closing date price":
- From the graph:
- April: Opening ~72, Closing ~73. Change = +1.
- May: Opening ~73, Closing ~75. Change = +2.
- June: Opening ~78, Closing ~71. Change = -7.
- From the graph:
- Check if "All depicted prices lie between 70 and 80":
- From the graph, the lowest price for April falls below 70. Thus, this statement is incorrect.
Conclusion: The incorrect statement is: "The highest price never crossed 75."
Important Questions from Data Interpetation (Notes)
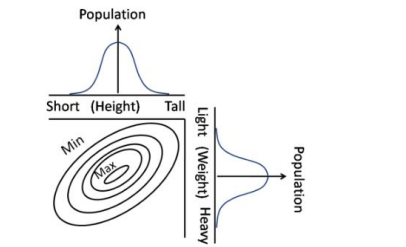
Contours in the bivariate (weight, height) graph connect regions of approximately equal popula-tions. Which of the following interpretations is correct?
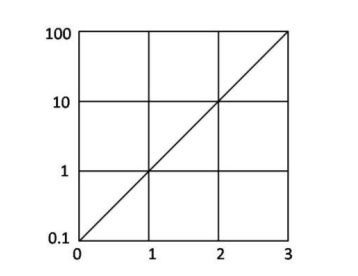
The function $f(x)$ is plotted against $x$ as shown. Extrapolate and find the value of the function at $x = -1$.
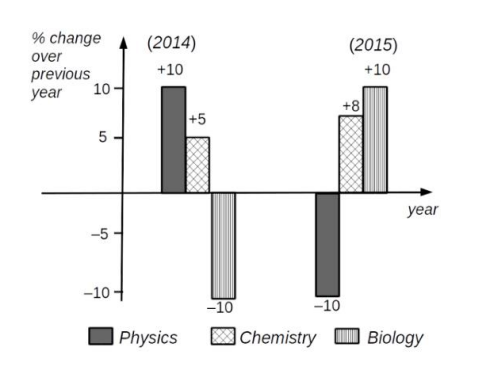
Which of the following inferences can be drawn from the above graph?
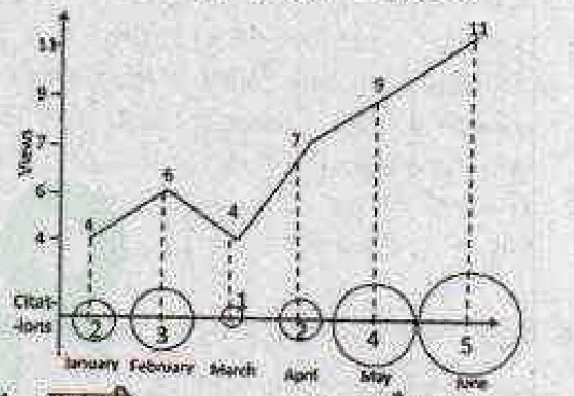
Number of times a research paper is viewed and cited is shown in the plot. In which month was the percentage increase in citation more than the double of the percentage increase in view?
- There are two examinations, A and B in a subject which are evaluated out of 30 and 70 marks, respectively. In order to pass the course the student has to get at least 40 % in total and at least 40 % in B. The following are the marks of the students $S_1$ to $S_4$.
Students A B $S_1$ 12 28 $S_2$ 10 29 $S_3$ 16 27 $S_4$ 05 29
The only student/s to have passed is/are


