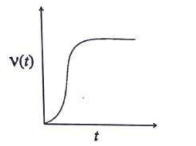
Which one of the following graphs represents the velocity-time ($v-t$) graph of a small spherical body falling in a viscous liquid?
To determine the correct velocity-time graph representing a small spherical body falling in a viscous liquid, we need to understand the physics of the scenario.
- The body experiences two main forces: gravitational force pulling it downwards and a viscous drag force opposing its motion.
- Initially, when the body starts falling, the gravitational force is dominant, and the velocity of the body increases.
- As the velocity increases, the viscous drag force also increases, which acts opposite to the gravitational force. This results in a net force that gradually decreases.
- Eventually, the body reaches a terminal velocity where the gravitational force equals the viscous drag force. At this point, the net force is zero, and thus the acceleration is zero.
- When the body reaches terminal velocity, it falls with a constant velocity.
From the above reasoning, the velocity-time graph should depict an initial increase in velocity followed by a constant velocity after some time.
The correct graph is the first option, where the velocity initially increases and then becomes constant, indicating the body has reached terminal velocity.
Similar Questions
- Two spherical soap bubbles of radii $r_1$ and $r_2$ in vaccum coalesce under isothermal condition. The newly formed bubble has a radius ($r$) given by
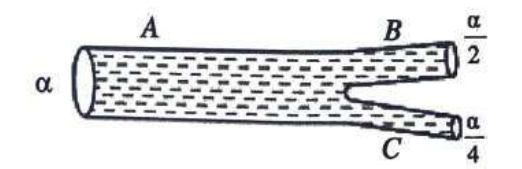
A pipe $A$ is connected with other pipes $B$ and $C$ as shown in the figure. The areas of cross-section of $A, B$ and $C$ are respectively $\alpha, \frac{\alpha}{2}$ and $\frac{\alpha}{4}$. If the velocities of flow of water through $A$ and $B$ are $10\text{ m/sec}$ and $6\text{ m/sec}$, respectively, then velocity of flow, $V_{c}$ along $C$ is
Important Questions from Mechanical Properties of Matter
- The terminal velocity of a metallic ball of radius $6\text{ mm}$ in a viscous fluid is $20\text{ cm/s}$. The terminal velocity of another ball of same material and having radius $3\text{ mm}$ in the same fluid will be __________ $\text{cm/s}$.
- Sixty four rain drops of radius 1 mm each falling down with a terminal velocity of 10 cm/s coalesce to form a bigger drop. The terminal velocity of bigger drop is ______ cm/s.
- Two spherical soap bubbles of radii $r_1$ and $r_2$ in vaccum coalesce under isothermal condition. The newly formed bubble has a radius ($r$) given by
A pipe $A$ is connected with other pipes $B$ and $C$ as shown in the figure. The areas of cross-section of $A, B$ and $C$ are respectively $\alpha, \frac{\alpha}{2}$ and $\frac{\alpha}{4}$. If the velocities of flow of water through $A$ and $B$ are $10\text{ m/sec}$ and $6\text{ m/sec}$, respectively, then velocity of flow, $V_{c}$ along $C$ is
- A small metallic sphere of diameter 2 mm and density $10.5 \text{ g/cm}^3$ is dropped in glycerine having viscosity 10 Poise and density $1.5 \text{ g/cm}^3$ respectively. The terminal velocity attained by the sphere is ____ cm/s. ($\pi = \frac{22}{7}$ and $g = 10 \text{ m/s}^2$)