
The following Pie-Charts show the percentage of different categories (A, B, C, D, E and F) of employees in a company in the year 2019 and 2020. The total number of employees was 4000 in 2019 and 5000 in 2020.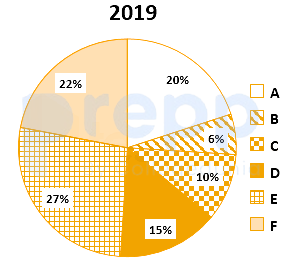
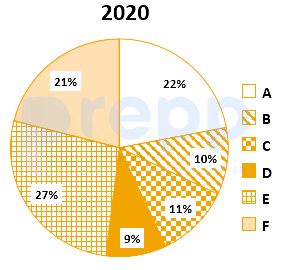
There are two categories of employees in 2019 whose total strength remained the same in 2020. What are these two categories ?
C and D
Given
Total number of employees in 2019 = 4000
Total number of employees in 2020 = 5000
Calculation
For category A,
Total number employee of category A in 2019 = 20 × 4000/100 = 800
Total number employee of category A in 2020 = 22 × 5000/100 = 1100
For category B,
Total number employee of category B in 2019 = 6 × 4000/100 = 240
Total number employee of category B in 2020 = 10 × 5000/100 = 500
For category C,
Total number employee of category C in 2019 = 10 × 4000/100 = 400
Total number employee of category C in 2020 = 11 × 5000/100 = 550
For category D,
Total number employee of category D in 2019 = 15 × 4000/100 = 600
Total number employee of category D in 2020 = 9 × 5000/100 = 450
For category E,
Total number employee of category E in 2019 = 27 × 4000/100 = 1080
Total number employee of category E in 2020 = 27 × 5000/100 = 1350
For category F,
Total number employee of category F in 2019 = 22 × 4000/100 = 880
Total number employee of category F in 2020 = 21 × 5000/100 = 1050
Number of employees in C and D in 2019 = (400 + 600) = 1000
Number of employees in C and D in 2020 = (550 + 450) =1000
So clearly see that total of C and D in 2019 and 2020 remain same.
∴ The correct answer is C and D
Similar Questions
How much less amount is allocated to A and C together as compared to B, D and E together?
How much amount will be increased on A if the total budget is increased by three times?
A pie chart is drawn for the following data:
Sector
Percentage
Agriculture and Rural development
12.9
Irrigation
12.5
Energy
27.2
Industry and Minerals
15.4
Transport and communication
15.9
Social services
16.1
What is the angle (approximately) subtended by the social services sector at the centre of the circle?
The pie diagrams on the monthly expenditure of two families A and B are drawn with radii of two circles taken in the ratio 16 : 9 to compare their expenditures.
Which one of the following is the appropriate data used for the above mentioned pie diagram?Which one of the following is not correct?
The proportion of various items in a pie diagram is proportional to theIn a pie diagram, there are four slices with angles 150°, 90°, 60° and 60°. A new pie diagram is formed by deleting one of the slices having angle 60° in the given pie diagram. In the new pie diagram
In which one of the following categories of employees, the percentage change in number of employees in 2020 was maximum as compared to 2019?
What was the percentage increase of category-E employees in 2020 as compared to that in 2019 ?
There are two categories of employees whose strength increased/decreased by same percentage in 2020. What are the two categories ?
Important Questions from Pie Chart
Study the following pie-charts carefully to answer the questions.
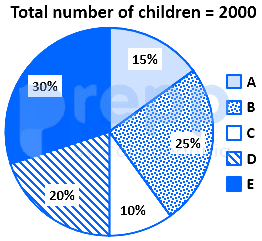
If 70 percent children from village D go to school then what is the number of children attending school from village D ?
Study the following pie-charts carefully to answer the questions.Percentage break-up of number of children in five different villages
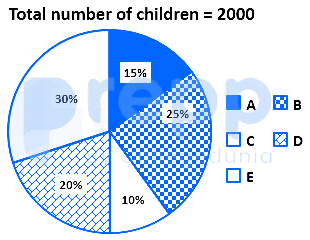
What is the respective ratio of total number of children from village A to village C ?
Study the following pie-charts carefully to answer the questions.Percentage break-up of number of children in five different villages
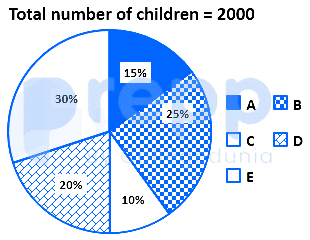
What is the total number of children in villages B and E ?
Study the chart and answer the question based, on the pie chart.The pie chart is given below shows expenditures incurred by a family on various items and savings in a month. Savings of the family is ₹ 8,000 in a month.
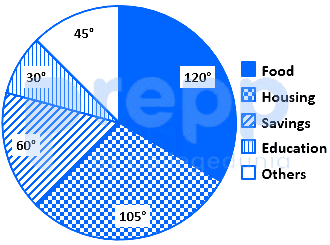
What is the total expenditure of the family for the month?
Study the chart and answer the question based, on the pie chart.The pie chart given below shows expenditures incurred by a family on various items and savings in a month. Savings of the family is ₹ 8,000 in a month.
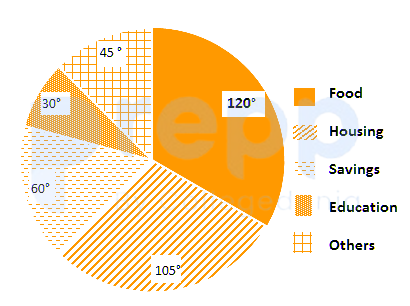
How much more amount is spent on food than on housing?



