
The pie diagrams on the monthly expenditure of two families A and B are drawn with radii of two circles taken in the ratio 16 : 9 to compare their expenditures.
Rs. 25,600 and Rs. 8,100
Analyzing Expenditure Comparison with Pie Diagrams and Radius Ratios
When comparing different quantities using pie diagrams, the total quantity being represented by each diagram is proportional to the area of the circle. The area of a circle is calculated using the formula \(\text{Area} = \pi r^2\), where \(r\) is the radius of the circle.
In this question, we are comparing the monthly expenditures of two families, A and B, using pie diagrams. The radii of the two circles drawn for these diagrams are in the ratio 16 : 9. This means if the radius of the pie diagram for Family A is \(r_A\) and for Family B is \(r_B\), then:
\(\frac{r_A}{r_B} = \frac{16}{9}\)
Since the total expenditure is represented by the area of the circle, and the area is proportional to the square of the radius (\(r^2\)), the ratio of the expenditures will be the square of the ratio of the radii.
Let \(E_A\) be the total expenditure of Family A and \(E_B\) be the total expenditure of Family B. Then:
\(\frac{E_A}{E_B} = \frac{\text{Area}_A}{\text{Area}_B} = \frac{\pi r_A^2}{\pi r_B^2} = \frac{r_A^2}{r_B^2} = \left(\frac{r_A}{r_B}\right)^2\)
Substituting the given ratio of radii:
\(\frac{E_A}{E_B} = \left(\frac{16}{9}\right)^2 = \frac{16^2}{9^2} = \frac{256}{81}\)
So, the appropriate data for the total expenditures of families A and B should be in the ratio 256 : 81.
Let's examine the given options to find which pair of expenditures has a ratio of 256 : 81.
Option 1: Rs. 16,000 and Rs. 9,000
Ratio = \(\frac{16000}{9000} = \frac{16}{9}\). This is the ratio of radii, not the required ratio of expenditures.
Option 2: Rs. 8,000 and Rs. 4,500
Ratio = \(\frac{8000}{4500} = \frac{80}{45}\). Dividing both by 5, we get \(\frac{16}{9}\). This is also the ratio of radii, not the required ratio of expenditures.
Option 3: Rs. 25,600 and Rs. 8,100
Ratio = \(\frac{25600}{8100} = \frac{256}{81}\). This ratio matches the calculated ratio of expenditures required for the radii ratio of 16:9.
Option 4: Rs. 4,000 and Rs. 3,000
Ratio = \(\frac{4000}{3000} = \frac{4}{3}\). This ratio does not match the required ratio of expenditures.
Based on the analysis, only the expenditures Rs. 25,600 and Rs. 8,100 have the correct ratio (256:81) corresponding to the radii ratio (16:9) for comparing total expenditures using pie diagrams.
The data used for the two pie diagrams should represent total expenditures in the ratio that is the square of the ratio of their radii.
Revision Table: Pie Diagram Ratios
| Concept | Relationship | Formula/Ratio |
|---|---|---|
| Area of Circle | Proportional to square of radius | \(\text{Area} = \pi r^2 \implies \text{Area} \propto r^2\) |
| Total Quantity in Pie Chart | Proportional to Area of circle | Total Quantity \(\propto\) Area |
| Ratio of Total Quantities | Square of the ratio of Radii | \(\frac{\text{Quantity}_1}{\text{Quantity}_2} = \left(\frac{r_1}{r_2}\right)^2\) |
| Ratio of Radii | Square root of the ratio of Total Quantities | \(\frac{r_1}{r_2} = \sqrt{\frac{\text{Quantity}_1}{\text{Quantity}_2}}\) |
Additional Information: Comparing Data with Pie Charts
Pie charts are commonly used to show how a whole is divided into parts. Each sector of the pie represents a proportion of the total. When comparing two different totals using separate pie charts, it is important that the areas of the circles accurately reflect the ratio of the total amounts being compared.
If the radii of the circles are simply made proportional to the totals, it leads to a misleading comparison because the area (which represents the total amount) grows with the square of the radius, not linearly with the radius. Therefore, to maintain the correct visual proportion based on area, the radius should be proportional to the square root of the total amount.
Conversely, if the radii are in a specific ratio, the total amounts they represent for accurate comparison must be in the ratio of the squares of those radii. This ensures that the area of each circle is proportional to the total value it depicts.
In this problem, the radii ratio is 16:9. To make the areas represent the total expenditures correctly, the expenditure ratio must be \((16)^2 : (9)^2\), which is 256 : 81.
Similar Questions
How much less amount is allocated to A and C together as compared to B, D and E together?
How much amount will be increased on A if the total budget is increased by three times?
A pie chart is drawn for the following data:
Sector
Percentage
Agriculture and Rural development
12.9
Irrigation
12.5
Energy
27.2
Industry and Minerals
15.4
Transport and communication
15.9
Social services
16.1
What is the angle (approximately) subtended by the social services sector at the centre of the circle?
Which one of the following is not correct?
The proportion of various items in a pie diagram is proportional to theIn a pie diagram, there are four slices with angles 150°, 90°, 60° and 60°. A new pie diagram is formed by deleting one of the slices having angle 60° in the given pie diagram. In the new pie diagram
There are two categories of employees in 2019 whose total strength remained the same in 2020. What are these two categories ?
In which one of the following categories of employees, the percentage change in number of employees in 2020 was maximum as compared to 2019?
What was the percentage increase of category-E employees in 2020 as compared to that in 2019 ?
There are two categories of employees whose strength increased/decreased by same percentage in 2020. What are the two categories ?
Important Questions from Pie Chart
Study the following pie-charts carefully to answer the questions.
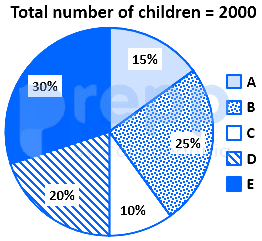
If 70 percent children from village D go to school then what is the number of children attending school from village D ?
Study the following pie-charts carefully to answer the questions.Percentage break-up of number of children in five different villages
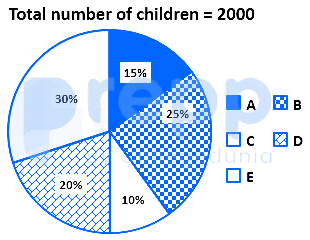
What is the respective ratio of total number of children from village A to village C ?
Study the following pie-charts carefully to answer the questions.Percentage break-up of number of children in five different villages
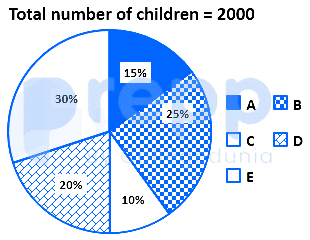
What is the total number of children in villages B and E ?
Study the chart and answer the question based, on the pie chart.The pie chart is given below shows expenditures incurred by a family on various items and savings in a month. Savings of the family is ₹ 8,000 in a month.
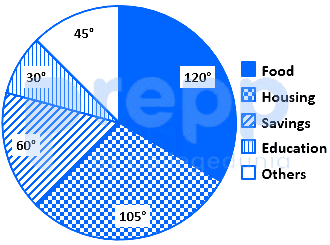
What is the total expenditure of the family for the month?
Study the chart and answer the question based, on the pie chart.The pie chart given below shows expenditures incurred by a family on various items and savings in a month. Savings of the family is ₹ 8,000 in a month.
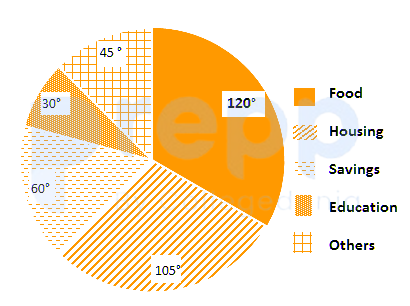
How much more amount is spent on food than on housing?



