The following plots show variation of velocity ($v$) with time ($t$) of a ball thrown vertically upward, and falling back. Which of the following plots is/are correct?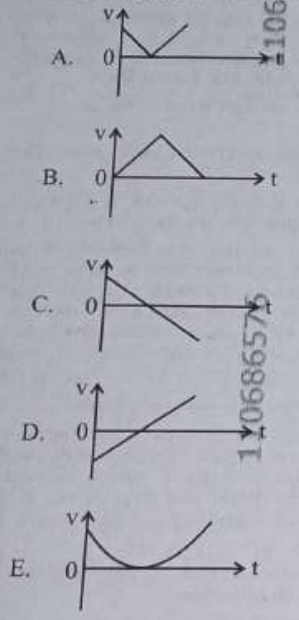
C only
The question involves identifying the correct velocity-time plot for a ball thrown vertically upwards and falling back down. Here, we analyze the plots based on the motion characteristics of the ball:
- Initially, the ball is thrown upwards with an initial velocity, so the velocity is positive.
- As the ball rises, it slows down due to gravity, and the velocity decreases until it reaches zero at the highest point.
- After reaching the highest point, the ball falls back, gaining speed in the negative direction (downward), so the velocity becomes negative.
Based on these characteristics, the correct plot should start from a positive velocity, decrease to zero, and then continue into negative values.
Let's examine the options:
- Option A: The plot shows a sudden change in velocity, which is incorrect as the velocity decreases gradually.
- Option B: The plot shows velocity decreasing to zero and remaining constant, which is incorrect as velocity cannot remain zero; it should become negative upon descent.
- Option C: This plot starts with a positive velocity, decreases to zero, and becomes negative. This correctly represents the motion of the ball.
- Option D: The plot suggests a continuous increase in velocity, which does not align with the motion described.
- Option E: The plot shows a continuous curve without a distinct transition to and from zero, which is incorrect for this scenario.
Thus, the correct answer is:
C only
Similar Questions
The power of a crane, which lifts a mass of $1000 \text{ kg}$ to a height of $20 \text{ m}$ in $10 \text{ s}$ is :
($g = 9.8 \text{ m/s}^2$)- The magnitude and direction of the acceleration produced in a body of mass $5 \text{ kg}$ when two mutually perpendicular forces $8 \text{ N}$ and $6 \text{ N}$ act on it, are respectively :
- A box of mass $15 \text{ kg}$ is kept on the floor of a stationary trolley. The coefficient of static friction between the box and the trolley is $0.12$. Keeping the box in stationary state over the trolley, the maximum acceleration with which the trolley can be moved horizontally is : ($g = 10 \text{ m/s}^2$)
- The amount of work done to raise a mass 'm' from the surface of the Earth to a height equal to the radius of the Earth 'R', will be :
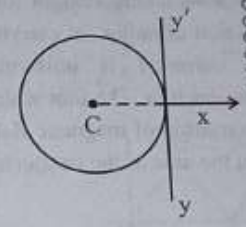
A thin wire of length 'L' and linear mass density 'm' is bent into a circular ring (in x-y plane) with centre 'C' as shown in figure. The moment of inertia of the ring about an axis yy' (tangent in the plane) will be :
- When a ruler falls vertically, 5 different persons catch it with different reaction times. ($g = 9.8 \text{ m s}^{-2}$)
A. Person A has reaction time of $0.20 \text{ s}$.
B. Person B has reaction time of $0.22 \text{ s}$.
C. Person C has reaction time of $0.18 \text{ s}$.
D. Person D has reaction time of $0.19 \text{ s}$.
E. Person E has reaction time of $0.21 \text{ s}$.
What is the correct order of the distance travelled by the ruler for each person ? - The angular speed of a flywheel is increased from $600 \text{ rpm}$ to $1200 \text{ rpm}$ in $10 \text{ s}$. The number of revolutions completed by the flywheel during this time is :
- Two planets $P_1$ and $P_2$ with equal mass have radii $R_1$ and $R_2$, respectively, where $R_2 = \frac{R_1}{2}$. The escape speeds of $P_1$ and $P_2$ are $v_1$ and $v_2$, respectively. Then $\frac{v_2}{v_1}$ is :
- A car travels on a circular racetrack of radius $50\text{ m}$, which is banked at an angle $\theta$. If the car travels at a speed $10\text{ ms}^{-1}$, then the wear and tear on its tyres is minimum. Taking the acceleration due to gravity to be $10\text{ ms}^{-2}$, the value of $\theta$ is :
- Consider a particle moving along a straight line, whose position as a function of time is given by $s(t) = \alpha t^2 - \beta t + \gamma$, where $\alpha = 1\text{ ms}^{-2}$, $\beta = 6\text{ ms}^{-1}$ and $\gamma = 5\text{ m}$. The average speed of the particle, in $\text{ms}^{-1}$, from $t = 0$ to $t = 6\text{ s}$ is :
Important Questions from Mechanics
- The escape velocity from a spherical planet A is 10 km/s. The escape velocity from another planet B whose density and radius are 10% of those of planet A, is _________ m/s.
A cylindrical tube AB of length $l$, closed at both ends contains an ideal gas of 1 mol having molecular weight $M$. The tube is rotated in a horizontal plane with constant angular velocity $\omega$ about an axis perpendicular to AB and passing through the edge at end A, as shown in the figure. If $P_A$ and $P_B$ are the pressures at $A$ and $B$ respectively, then
(Consider the temperature is same at all points in the tube)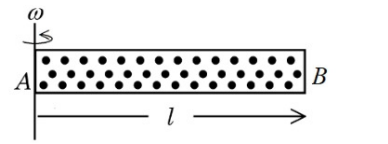
- A solid sphere of mass 5 kg and radius 10 cm is kept in contact with another solid sphere of mass 10 kg and radius 20 cm. The moment of inertia of this pair of spheres about the tangent passing through the point of contact is _________ $\text{kg.m}^2$.
- A circular disc has radius $R_1$ and thickness $T_1$. Another circular disc made of the same material has radius $R_2$ and thickness $T_2$. If the moment of inertia of both discs are same and $\frac{R_1}{R_2} = 2$ then $\frac{T_1}{T_2} = \frac{1}{\alpha}$. The value of $\alpha$ is _________.
- Given below are two statements :
Statement I : A satellite is moving around earth in the orbit very close to the earth surface. The time period of revolution of satellite depends upon the density of earth.
Statement II : The time period of revolution of the satellite is $T = 2\pi \sqrt{\frac{R_e}{g}}$ (for satellite very close to the earth surface), where $R_e$ radius of earth and g acceleration due to gravity.
In the light of the above statements, choose the correct answer from the options given below :