Study the given table and answer the question that follows. The following table shows the percentage distribution of students in four different schools during the years 2021-22. If there was a total number of 16,000 and 18,000 students during the years 2021 and 2022 respectively, then the difference in number of students in school 4 in 2022 with respect to 2021 is:Year School 1 School 2 School 3 School 4 2021 28 25 24 23 2022 27 28 23 22
280
Calculating the number of students in School 4 in both years using the given percentages and subtracting gives a difference of 280 students.
Similar Questions
The time spent to study history and chemistry is 4 hours 30 minutes. Then the student studied physics for
If the student studied chemistry for 3 hours, then he/she studied geography for
If the student studied 10 hours in a day, then he/she studied mathematics for
If the student spends 15% instead of 10% on others, and that 5% is taken from mathematics, then the difference in study time for mathematics (when studying 20 hours/day) is
Approximately how much percent of voters voted in favour of X?
Approximately how much percent of voters did not caste their votes?
In region B, Y gets A% more votes than X. Find the value of A?
Nearly what percentage of his total votes did X receive from region B?
.Study the Bar diagram carefully and answer the questions. The Bar diagram shows the trends of foreign direct investment (FDI) into India from all over the World (in Rs. crores).
The sum of FDI of 1992 and 1993 is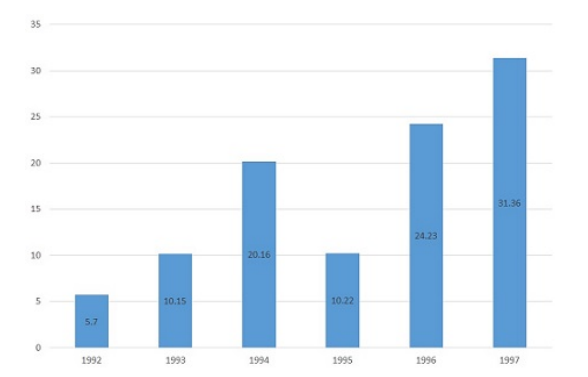
.Study the Bar diagram carefully and answer the questions. The Bar diagram shows the trends of foreign direct investment (FDI) into India from all over the World (in Rs. crores).
The year which exhibited the 2nd highest growth percentage in FDI in India over the period shown is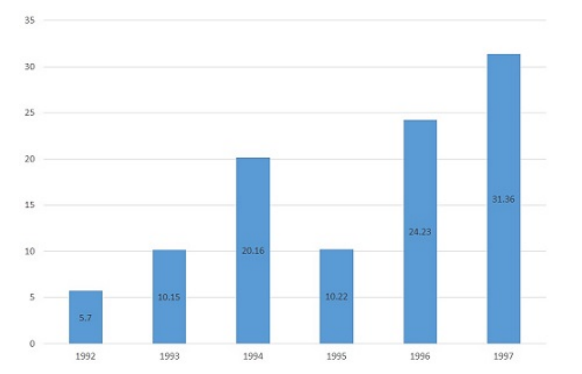
Important Questions from Data Interpretation
The table shows the monthly expenditure of Saumya. What percent of her monthly salary is she able to save?
Expense Amount Food 5,000 Rent 20,000 Travel 10,000 Clothing 3,000 Miscellaneous 15,000 Savings 7,500 Following table provides figures (in rupees) on annual expenditure of a firm for two years – 2010 and 2011.
Category
2010
2011
Raw material
5200
6240
Power & fuel
7000
9450
Salary & wages
9000
12600
Plant & machinery
20000
25000
Advertising
15000
19500
Research & Development
22000
26400
In 2011, which of the following two categories have registered increase by same percentage?
The time spent to study history and chemistry is 4 hours 30 minutes. Then the student studied physics for
If the student studied chemistry for 3 hours, then he/she studied geography for
If the student studied 10 hours in a day, then he/she studied mathematics for