Comprehension:
Read the following passage and answer the questions :
In India, more than 58.6% of the landmass is prone to earthquakes, over 40 million hectares (12%) of its land is prone to floods and river erosion; about 5,700 km, out of the 7,516 km long coastline is prone to cyclones and tsunamis; 68% of its cultivable area is vulnerable to droughts; hilly areas are at risk from landslides and avalanches. However, there are risk due to manmade disasters also. Disaster risks can be further compounded by vulnerabilities related to changing demographics, poor socio-economic condition, unplanned urbanization, haphazard construction within high-risk zones, environmental degradation and poor management of natural resources, climate change, epidemics and pandemics. National Disaster Management Authority (NDMA) has put together this 'National Guidelines on Temporary Shelters for the Disaster-Affected Families.' The document provides guidance to states to develop a systematic intermediate shelter response programme. These guidelines give early recovery framework, for use in post-disaster situations and it will help primarily to government officials from various disaster management authorities, technical, professionals, including engineers, architects and planners working in housing related agencies. Civil Society Organisations (CSO), Non-Governmental organisations (NGOs) and Private Sector involved in humanitarian and shelter response after disasters. The Guidelines are based on understanding that intermediate shelters are important not only for more effective planning of permanent housing but are critical for early recovery of daily livelihoods and recovery of their socio-cultural life. Intermediate shelters can set direction for long-term housing recovery. This document includes principles, implementation arrangements, roles and responsibilities, to ensure social inclusion.
Land Area Calculation for Flood & River Erosion Vulnerability
The question asks to find the total land area (in million hectares) where 12% of this area is prone to flood and river erosion. The provided passage states that 'over 40 million hectares (12%) of its land is prone to floods and river erosion'. This directly gives us the percentage and the corresponding area.
Determining Total Land Area
We are given that 12% of the total land area is equal to approximately 40 million hectares.
Let the total land area be denoted by T (in million hectares).
According to the passage:
$12\% \text{ of } T = 40 \text{ million ha}$To find the total area T, we can set up the equation:
$0.12 \times T = 40$Now, we solve for T:
$T = \frac{40}{0.12}$ $T = \frac{40}{\frac{12}{100}}$ $T = \frac{40 \times 100}{12}$ $T = \frac{4000}{12}$Simplifying the fraction:
$T = \frac{1000}{3}$ $T \approx 333.33$Therefore, the total area of land is approximately 333.33 million hectares.
Comparing this result with the given options, 333 is the closest value.
Important Questions from Data Interpretation
- What is the key advantage of using Geographic Information Systems (GIS) in disaster research?
The total runs scored by four cricketers P, Q, R, and S in years $2009$ and $2010$ are given in the following table:
Player $2009$ $2010$ P $802$ $1008$ Q $765$ $912$ R $429$ $619$ S $501$ $701$
The player with the lowest percentage increase in total runs isStudy the given table and answer the following question:
Annual consumption (in hundred tonnes) of tea in five states (A, B, C, D and E) across 6 years (2014 to 2019):State Year A B C D E 2014 112 130 136 105 117 2015 122 138 150 140 120 2016 124 134 142 144 132 2017 132 154 198 149 133 2018 135 148 187 151 145 2019 153 136 198 150 187 The total consumption of tea in state C in 2015 to 2017 is by what percentage more than the total consumption of tea in states A, B and D in 2015?
The table below shows the number of toys of 6 different colours sold from a shop during a given period. The table also shows the percentage of toys of each colour which are cars.
Colour Total toys Percentage of cars C1 500 12 C2 600 15 C3 400 12.5 C4 550 10 C5 650 20 C6 450 10 What is the total number of car toys of C2 and C3 taken together?
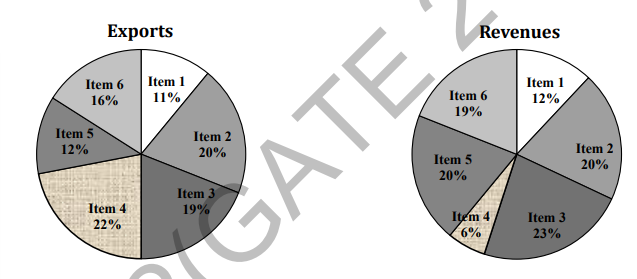
The total exports and revenues from the exports of a country are given in the two pie charts below. The pie chart for exports shows the quantity of each item as a percentage of the total quantity of exports. The pie chart for the revenues shows the percentage of the total revenue generated through export of each item. The total quantity of exports of all the items is 5 lakh tonnes and the total revenues are 250 crore rupees. What is the ratio of the revenue generated through export of Item 1 per kilogram to the revenue generated through export of Item 4 per kilogram?