GIS Advantage for Analyzing Disaster Data
Geographic Information Systems (GIS) offer powerful tools for understanding and managing geographical information. In the field of disaster research, GIS provides a significant advantage by enabling the effective handling of location-based data.
Understanding GIS in Disaster Research
GIS technology integrates various data types, such as maps, satellite imagery, demographic information, and environmental data, allowing researchers to see how different factors relate to each other in specific geographic areas. This is particularly crucial when studying disasters, which have a distinct spatial component.
Key Benefit: Spatial Data Visualization and Analysis
The primary advantage of using GIS in disaster research lies in its ability to:
- Visualize spatial data: GIS allows researchers to create maps and visual representations of disaster-related information. This includes mapping the extent of damage, identifying affected populations, locating critical infrastructure, and showing the path of a hazard (like a flood inundation area or wildfire spread). Visualizing this spatial data makes complex information easier to grasp quickly.
- Analyze spatial data: Beyond simple visualization, GIS provides analytical tools. Researchers can perform spatial queries, overlay different data layers (e.g., population density over flood zones), conduct suitability analysis, and model potential impacts. This deep analysis helps in understanding the causes, effects, and patterns of disasters.
By combining visualization and analysis, GIS helps researchers gain a comprehensive understanding of disaster scenarios, identify vulnerable areas, and plan more effective mitigation and response strategies.
Evaluating Other Options
Let's look at why the other options are not the key advantage:
- Prediction without data input: GIS is a tool that requires data to function. While it can be used in predictive modeling for disasters, it cannot predict events without relevant data input (e.g., weather patterns, seismic data, historical records).
- Eliminating collaboration: Disaster research and management often require extensive collaboration. GIS facilitates information sharing but does not eliminate the need to work with local authorities, emergency responders, and communities. Effective disaster response relies heavily on teamwork.
- Focusing exclusively on urban environments: While GIS is widely used in urban planning and disaster management, its application is not limited to cities. It is equally valuable for studying disasters in rural areas, natural environments, and across different geographical scales.
Therefore, the core strength of GIS in disaster research is its capacity for visualizing and analyzing spatial data related to various hazards.
Important Questions from Data Interpretation
- What will be the total area of land (million ha) of which 12% area is prone to flood and river erosion ?
The total runs scored by four cricketers P, Q, R, and S in years $2009$ and $2010$ are given in the following table:
Player $2009$ $2010$ P $802$ $1008$ Q $765$ $912$ R $429$ $619$ S $501$ $701$
The player with the lowest percentage increase in total runs isStudy the given table and answer the following question:
Annual consumption (in hundred tonnes) of tea in five states (A, B, C, D and E) across 6 years (2014 to 2019):State Year A B C D E 2014 112 130 136 105 117 2015 122 138 150 140 120 2016 124 134 142 144 132 2017 132 154 198 149 133 2018 135 148 187 151 145 2019 153 136 198 150 187 The total consumption of tea in state C in 2015 to 2017 is by what percentage more than the total consumption of tea in states A, B and D in 2015?
The table below shows the number of toys of 6 different colours sold from a shop during a given period. The table also shows the percentage of toys of each colour which are cars.
Colour Total toys Percentage of cars C1 500 12 C2 600 15 C3 400 12.5 C4 550 10 C5 650 20 C6 450 10 What is the total number of car toys of C2 and C3 taken together?
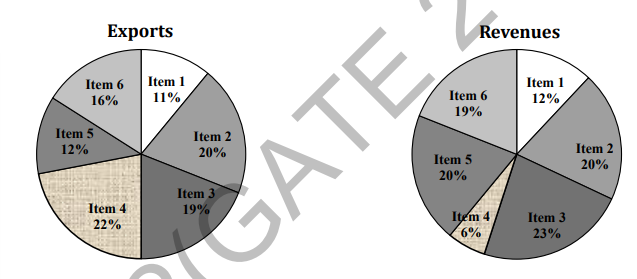
The total exports and revenues from the exports of a country are given in the two pie charts below. The pie chart for exports shows the quantity of each item as a percentage of the total quantity of exports. The pie chart for the revenues shows the percentage of the total revenue generated through export of each item. The total quantity of exports of all the items is 5 lakh tonnes and the total revenues are 250 crore rupees. What is the ratio of the revenue generated through export of Item 1 per kilogram to the revenue generated through export of Item 4 per kilogram?