The total runs scored by four cricketers P, Q, R, and S in years $2009$ and $2010$ are given in the following table:
Player $2009$ $2010$ P $802$ $1008$ Q $765$ $912$ R $429$ $619$ S $501$ $701$
The player with the lowest percentage increase in total runs is
Analyzing Cricketers' Run Increase
The question asks for the player with the lowest percentage increase in runs scored between the years 2009 and 2010. We need to calculate this percentage for each player.
Runs Data Table
| Player | 2009 Runs | 2010 Runs |
| P | 802 | 1008 |
| Q | 765 | 912 |
| R | 429 | 619 |
| S | 501 | 701 |
Percentage Increase Calculation
The formula for percentage increase is:
$ \text{Percentage Increase} = \frac{(\text{Runs in } 2010 - \text{Runs in } 2009)}{\text{Runs in } 2009} \times 100\% $Let's calculate the percentage increase for each player:
- Player P:
Increase = $1008 - 802 = 206$
Percentage Increase = $ \frac{206}{802} \times 100\% \approx 25.69\% $ - Player Q:
Increase = $912 - 765 = 147$
Percentage Increase = $ \frac{147}{765} \times 100\% \approx 19.22\% $ - Player R:
Increase = $619 - 429 = 190$
Percentage Increase = $ \frac{190}{429} \times 100\% \approx 44.29\% $ - Player S:
Increase = $701 - 501 = 200$
Percentage Increase = $ \frac{200}{501} \times 100\% \approx 39.92\% $
Identifying the Lowest Percentage Increase
Comparing the calculated percentage increases:
- P: $ \approx 25.69\% $
- Q: $ \approx 19.22\% $
- R: $ \approx 44.29\% $
- S: $ \approx 39.92\% $
The lowest percentage increase is approximately $19.22\%$, which corresponds to Player Q.
Important Questions from Data Interpretation
- What is the key advantage of using Geographic Information Systems (GIS) in disaster research?
- What will be the total area of land (million ha) of which 12% area is prone to flood and river erosion ?
Study the given table and answer the following question:
Annual consumption (in hundred tonnes) of tea in five states (A, B, C, D and E) across 6 years (2014 to 2019):State Year A B C D E 2014 112 130 136 105 117 2015 122 138 150 140 120 2016 124 134 142 144 132 2017 132 154 198 149 133 2018 135 148 187 151 145 2019 153 136 198 150 187 The total consumption of tea in state C in 2015 to 2017 is by what percentage more than the total consumption of tea in states A, B and D in 2015?
The table below shows the number of toys of 6 different colours sold from a shop during a given period. The table also shows the percentage of toys of each colour which are cars.
Colour Total toys Percentage of cars C1 500 12 C2 600 15 C3 400 12.5 C4 550 10 C5 650 20 C6 450 10 What is the total number of car toys of C2 and C3 taken together?
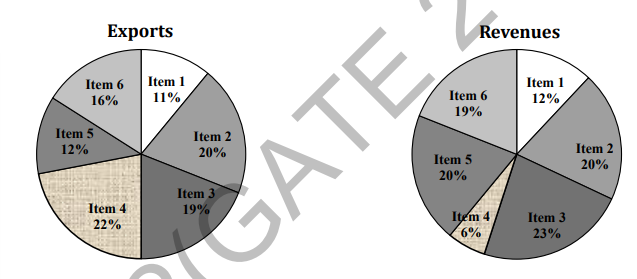
The total exports and revenues from the exports of a country are given in the two pie charts below. The pie chart for exports shows the quantity of each item as a percentage of the total quantity of exports. The pie chart for the revenues shows the percentage of the total revenue generated through export of each item. The total quantity of exports of all the items is 5 lakh tonnes and the total revenues are 250 crore rupees. What is the ratio of the revenue generated through export of Item 1 per kilogram to the revenue generated through export of Item 4 per kilogram?