In the above figure, the curves A, B and C denote____, ____ and ____ distributions, respectively.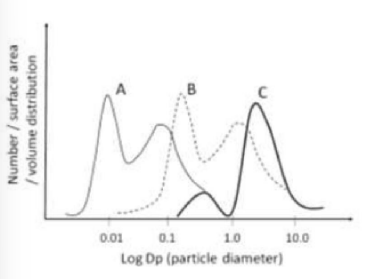
In this question, we need to identify which distribution curves A, B, and C represent: number, surface area, and volume. Let's analyze each curve.
Understanding these types of distributions in relation to particle size is crucial for interpreting what each curve represents:
-
Number Distribution:
Number distribution peaks at smaller particle diameters because there are usually more small particles than large particles. This is typically the leftmost curve.
-
Surface Area Distribution:
Surface area is proportional to the square of the diameter. Hence, medium-sized particles contribute more significantly to the surface area than the smallest or largest particles.
-
Volume Distribution:
Volume is proportional to the cube of the diameter, so larger particles will dominate the volume distribution, making this the rightmost curve.
From this analysis, we can establish:
- Curve A represents the number distribution as it peaks at the smallest particle diameter.
- Curve B represents the surface area distribution as it peaks at a medium particle diameter.
- Curve C represents the volume distribution due to peaking at the largest particle diameter.
Therefore, the correct answer is choice: number, surface area, and volume for curves A, B, and C, respectively.
Similar Questions
- The mixing ratio of water vapour in the Earth's atmosphere is approximately
- Oxygenation of the Earth's atmosphere was caused by
- The coldest part of the Earth's atmosphere is
- Secondary aerosols are products of
Important Questions from Principles Of Stratigraphy
- Which one of the following molecules is the most buoyant in the atmosphere?
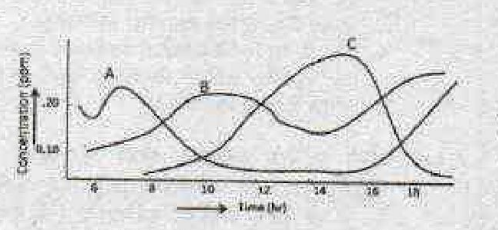
In the above diagram, A, B and C represent, respectively, the tropospheric concentrations of
- Oxygen atom required to form tropospheric ozone comes from
- Atmospheric layers where convection takes place are
Radiocarbon, used for dating sediments, is produced at the top of the Earth's atmosphere by the