
Question
In the above diagram, A, B and C represent, respectively, the tropospheric concentrations of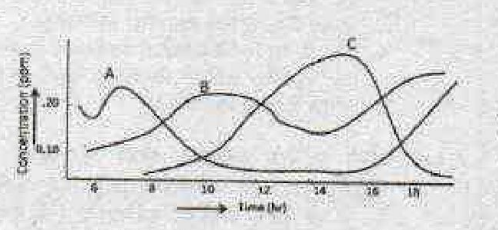
The correct answer is
$\text{NO}, \text{NO}_2, \text{O}_3$
To solve the question, we need to identify the tropospheric concentrations of NO, NO2, and O3 as represented in the graph by lines A, B, and C.
- Understanding the graph: The graph shows the variation in concentration of three atmospheric components over time (measured in hours). The concentration is displayed in ppm (parts per million).
- Analysis of the components:
- Line A: Typically, the concentration of NO peaks in the early morning and diminishes throughout the day. From the graph, Line A shows a pattern where it starts high at sunrise and decreases as the day progresses, consistent with typical NO behavior.
- Line B: NO2 concentrations generally increase during daylight due to photochemical reactions involving NO and ozone. Line B shows a pattern of increase during the day, which is characteristic of NO2.
- Line C: O3 concentration tends to rise during the day due to sunlight-driven reactions and peaks in the afternoon. Line C shows a rise in concentration during the day, peaking in the afternoon.
- Conclusion: Based on the expected behavior of these components, the correct representation is:
- A: NO
- B: NO2
- C: O3
Therefore, the correct answer is: $\text{NO}, \text{NO}_2, \text{O}_3$.
Was this answer helpful?
Important Questions from Principles Of Stratigraphy
- Which one of the following molecules is the most buoyant in the atmosphere?
- Oxygen atom required to form tropospheric ozone comes from
- Atmospheric layers where convection takes place are
Radiocarbon, used for dating sediments, is produced at the top of the Earth's atmosphere by the
Which of the following rare gases is the most abundant in the Earth's atmosphere?
Need Expert Advice?


