Simple Pendulum Kinetic Energy vs. Time Graph Analysis
Understanding Kinetic Energy in Simple Harmonic Motion
For a simple pendulum undergoing Simple Harmonic Motion (SHM), the kinetic energy ($K.E.$) varies cyclically with time ($t$). Key characteristics of this variation are:
- $K.E.$ is maximum at the mean (equilibrium) position where the pendulum's speed is greatest.
- $K.E.$ is zero at the extreme positions (maximum displacement) where the pendulum's speed momentarily drops to zero.
- Since $K.E. = \frac{1}{2} m v^2$, it is always non-negative ($K.E. \ge 0$).
- The kinetic energy pattern repeats every half of the time period ($T/2$). This means the frequency of $K.E.$ variation is double the frequency of the pendulum's oscillation. The mathematical form is often related to $\sin^2(\omega t)$ or $\cos^2(\omega t)$.
Analyzing the K.E. vs. Time Graph
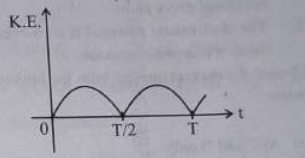
The correct graph representing $K.E.$ versus $t$ must satisfy these conditions:
- Non-Negative Values: The graph must always lie above or on the time axis ($K.E. \ge 0$). Graphs showing negative $K.E.$ are incorrect.
- Zero Points: $K.E.$ should be zero at times corresponding to the extreme positions of the pendulum.
- Maximum Points: $K.E.$ should reach its peak value at times corresponding to the mean position.
- Periodicity: The energy cycle (e.g., from zero to maximum and back to zero) should repeat twice within one full oscillation period ($T$), indicating a period of $T/2$ for the $K.E.$ variation itself.
Considering these points, if the pendulum starts at an extreme position ($t=0$), its $K.E.$ is $0$. It increases to a maximum at $t=T/4$ (mean position), decreases to $0$ at $t=T/2$ (other extreme), increases to a maximum again at $t=3T/4$, and returns to $0$ at $t=T$. Option B accurately displays this behavior, showing a wave that starts at zero, rises to a peak, falls back to zero, and repeats this pattern, staying entirely within the non-negative domain and exhibiting the required periodicity.
Similar Questions
For a travelling harmonic wave $y(x, t) = 2.0 \cos 2\pi(10 t - 0.0080 x + 0.35)$, where $x$ and $y$ are in cm and $t$ in s. The phase difference between oscillatory motion of two points separated by a distance of $0.5 \text{ m}$ is :
- The sum of kinetic energy and potential energy of a simple pendulum bob is $0.02 \text{ joule}$. The speed of the simple pendulum bob at equilibrium position is approximately :
(Consider mass of the bob = $20 \text{ g}$) - Consider a spring-mass simple harmonic oscillator in one dimension. The mass of the particle is $m\text{ kg}$ and the spring constant is $k\text{ Nm}^{-1}$. At a given instant, the extension of the spring is $x\text{ meter}$ and the speed of the particle is $v\text{ ms}^{-1}$. On the $x-v$ plane, if the graph of $v$ as a function of $x$ is a circle, then the correct option is :
- For sound waves, if the number of nodes for the $5^{\text{th}}$ harmonic of an open-ended pipe is $n$ and that for the $9^{\text{th}}$ harmonic of the same pipe with one of its ends closed is $m$, the ratio $\frac{n}{m}$ is :
- A cylindrical cork of uniform density floats in a liquid of density $\rho_1$. If the cork is depressed slightly and released, it oscillates harmonically with time period T. If the same cork floats in another liquid of density $\rho_2$, then the similar oscillation has time period 2T. The value of $\rho_2/\rho_1$ is :
Important Questions from Oscillations and Waves
- Two tuning forks $A$ and $B$ are sounded together giving rise to $8$ beats in $2\text{ s}$. When fork $A$ is loaded with wax, the beat frequency is reduced to $4$ beats in $2\text{ s}$. If the original frequency of tuning fork $B$ is $380\text{ Hz}$ then original frequency of tuning fork $A$ is _________ $\text{Hz}$.
- A simple pendulum of string length 30 cm performs 20 oscillations in 10 s. The length of the string required for the pendulum to perform 40 oscillations in the same time duration is ___________ cm. [Assume that the mass of the pendulum remains same.]
- The velocity of sound in air is doubled when the temperature is raised from $0^\circ\text{C}$ to $\alpha^\circ\text{C}$. The value of $\alpha$ is ________.
- The equation of a transverse wave is $y = y_0 \sin 2\pi(ft - \frac{x}{\lambda})$. If the maximum particle velocity be four times that of wave velocity then
- The velocity of a particle executing simple harmonic motion along $x$-axis is described as $v^2 = 50 - x^2$, where $x$ represents displacement. If the time period of motion is $\frac{x}{7}~\text{s}$, the value of $x$ is ________.