The following table shows the percentage (%) distribution of IT-related job vacancies in seven Indian cities, namely, Bangalore, Delhi, Hyderabad, Pune, Chennai, Mumbai and Calcutta during the years 2010 and 2020. Total number of vacancies in these cities in the years 2010 and 2020 are 5.4 lakh and 8.6 lakhs, respectively. Based on the data in the table, answer the questionCity Distribution (%) of Job Vacancies 2010 2020 Bangalore 15% 22% Delhi 21% 20% Hyderabad 10% 8% Pune 12% 6% Chennai 8% 10% Mumbai 10% 18% Calcutta 24% 16%
If the number of vacancies in Pune is 48000 in the year 2020 and the percentage distribution is same as given in the table, then what is the number of vacancies available in Delhi in 2020 ?
1.60 lakh
To find the number of job vacancies in Delhi for the year 2020, we need to use the provided percentage distribution of vacancies across different cities.
From the table, the percentage distribution of job vacancies in Pune for the year 2020 is given as 6%. It is noted that the actual number of vacancies in Pune is 48000.
To determine the total number of vacancies across all cities in 2020, we can use the percentage information for Pune:
- The percentage of vacancies in Pune = 6%.
- Total vacancies corresponding to 6% = 48000.
The formula to calculate the total vacancies is:
\(\text{Total Vacancies} = \frac{\text{Vacancies in Pune}}{\text{Percentage of Pune}} \times 100\)
Substituting the known values, we get:
\(\text{Total Vacancies} = \frac{48000}{6} \times 100 = 800000\)
Thus, the total number of vacancies across all cities in 2020 is 8,00,000.
Next, we calculate the number of vacancies in Delhi using the percentage distribution for 2020:
- The percentage of vacancies in Delhi = 20%.
Therefore, the number of vacancies in Delhi is calculated as:
\(\text{Vacancies in Delhi} = \frac{20}{100} \times 800000 = 160000\)
So, the number of vacancies available in Delhi in 2020 is 1.60 lakh.
Similar Questions
The ratio of the number of females to the number of males in City-E working in SBI, UCO and IOB together is :
The approximate percentage of the number of females with respect to the number of males across all the banks together in City-B is :
The number of females working in UCO from City-A is approximately _____ % more than the number of females working in PNB from the same city.
The total number of females working across all the six cities together is more than 1700 in :
The difference between the number of males working across all the six banks together in City-C and the number of males working across all the six banks together in City-D is :
What is the number of Model-Q cars sold in all cities together?
What is the difference between Model-P cars sold in city-D and city E ?
The number of Model-P cars sold in City D is approximately _____ % of the number of Model-R cars sold in City A
What is the ratio of the number of cars sold in City C to the number of Model-Q cars sold in City D?
Number of cars sold in City F is approximately _______ % more than the number of cars sold in City B
Important Questions from Tabulation
- An object is placed beyond the centre of curvature (C) of a concave mirror. The image formed will be now:
Directions:
Using the data from the graph answer the question below:
Find the total number of males from sector P and females from sector R together.
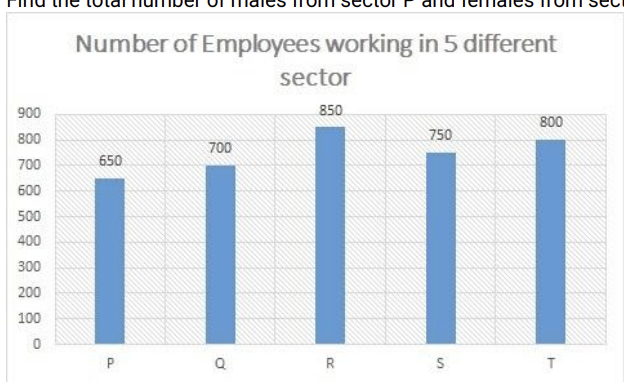
Ratio of number of male and female employees
Male Female P 6 7 Q 5 9 R 9 8 S 7 8 T 3 5 Directions:
Using the data from the graph answer the question below:
Number of Employees working in 5 different sector:
Find the number of males from sector Q.
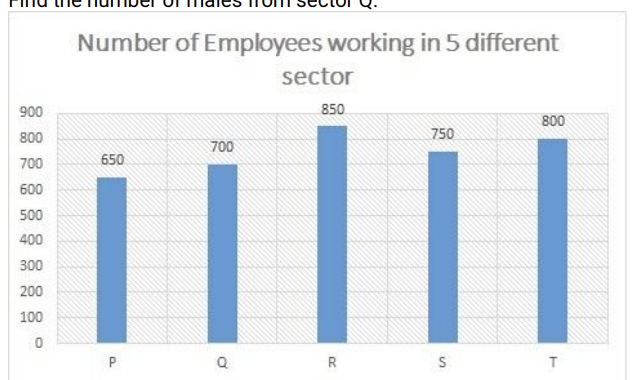
Ratio of number of male and female employees:
Male Female P 6 7 Q 5 9 R 9 8 S 7 8 T 3 5 Directions:
Using the data from the graph answer the question below:
Find the ratio between number of males from the sector T to number of females from the sector S.
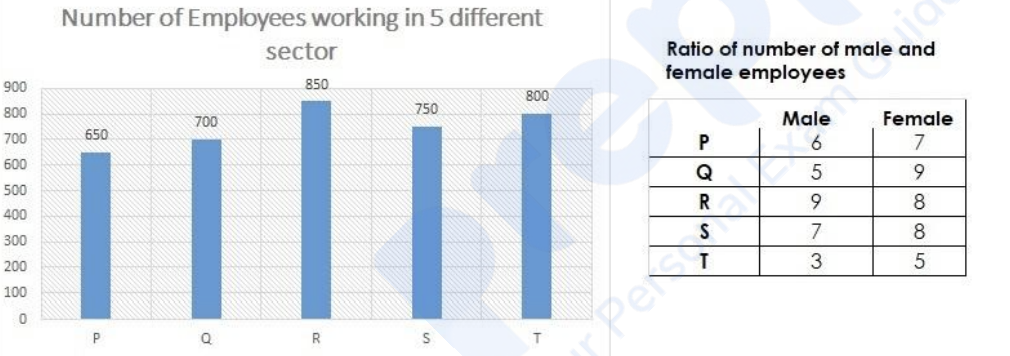
Directions:
Using the data from the graph answer the question below:
Find the total number of males from sector Q and females from sector P together.