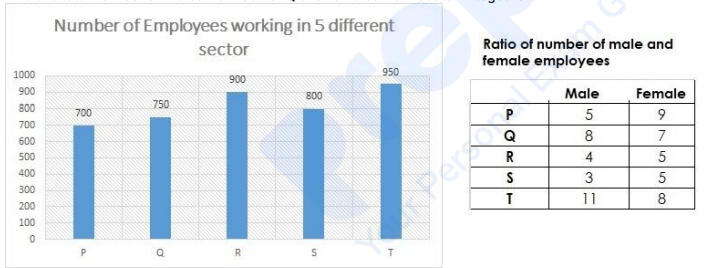
Directions: Using the data from the graph answer the question below: Find the ratio between number of males from the sector T to number of females from the sector S.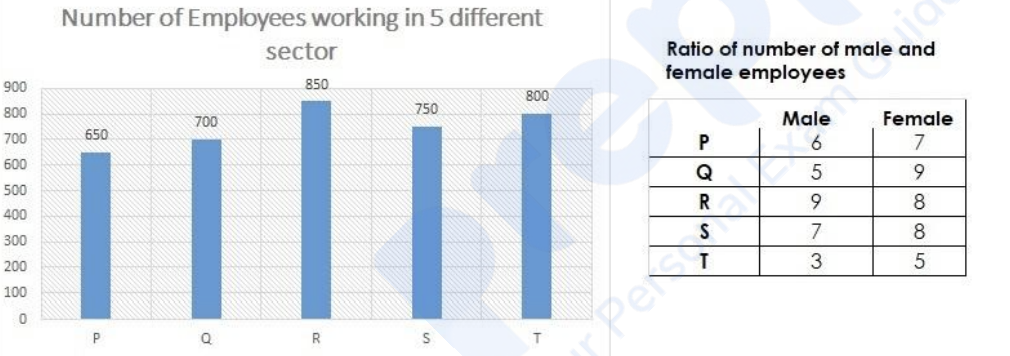
To find the ratio between the number of males from sector T to the number of females from sector S, we need to analyze the data from both the graph and the table provided.
From the graph, the total number of employees in each sector is given as follows:
- Sector P: 650
- Sector Q: 700
- Sector R: 850
- Sector S: 750
- Sector T: 800
The table provides the ratio of male to female employees in each sector:
- Sector T (Male:Female) = 3:5
- Sector S (Male:Female) = 7:8
Now, let's calculate the actual numbers:
- For Sector T:
- Male ratio = 3, Female ratio = 5
- Total ratio parts = 3 + 5 = 8
- Number of males = \(\frac{3}{8} \times 800 = 300\)
- For Sector S:
- Male ratio = 7, Female ratio = 8
- Total ratio parts = 7 + 8 = 15
- Number of females = \(\frac{8}{15} \times 750 = 400\)
Therefore, the ratio of the number of males from sector T to the number of females from sector S is:
\(\frac{300}{400} = \frac{3}{4}\)
Hence, the correct answer is 3:4.
Important Questions from Tabulation
- An object is placed beyond the centre of curvature (C) of a concave mirror. The image formed will be now:
Directions:
Using the data from the graph answer the question below:
Find the total number of males from sector P and females from sector R together.
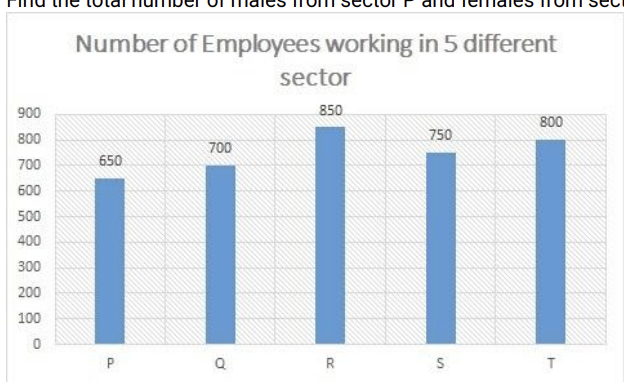
Ratio of number of male and female employees
Male Female P 6 7 Q 5 9 R 9 8 S 7 8 T 3 5 Directions:
Using the data from the graph answer the question below:
Number of Employees working in 5 different sector:
Find the number of males from sector Q.
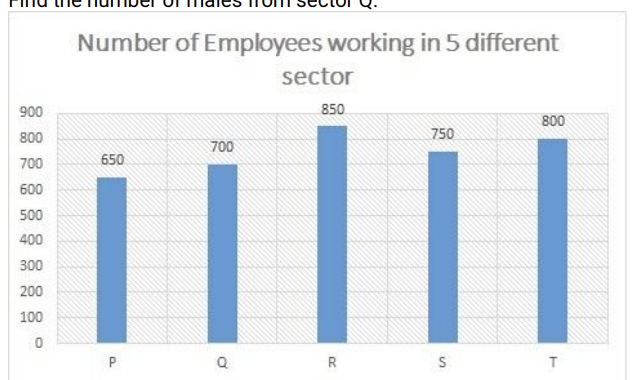
Ratio of number of male and female employees:
Male Female P 6 7 Q 5 9 R 9 8 S 7 8 T 3 5 Directions:
Using the data from the graph answer the question below:
Find the total number of males from sector Q and females from sector P together.
Directions:
Study the following Bar-chart and the data provided to answer the questions that follow:
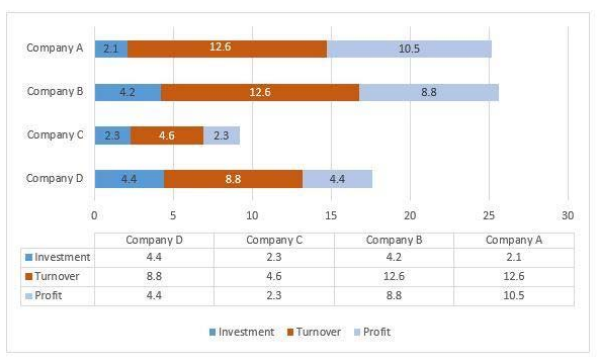
Investment, Turnover and Profit of four different companies A, B, C and D are given. (In Lakhs)
Out of the given four companies which one has highest profit proportion? (Profit proportion = Profit/Investment)