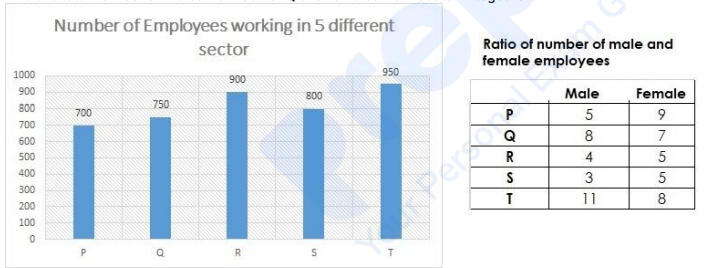
Directions: Using the data from the graph answer the question below: Find the total number of males from sector P and females from sector R together. Ratio of number of male and female employees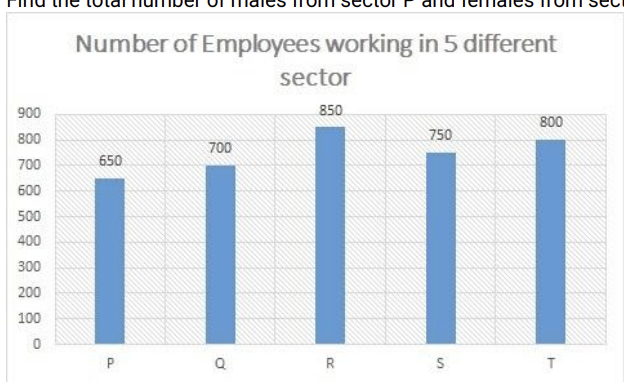
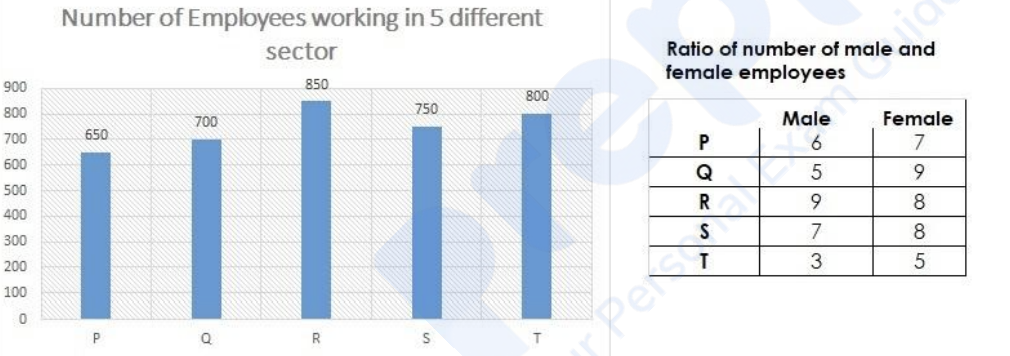
Male Female P 6 7 Q 5 9 R 9 8 S 7 8 T 3 5
To find the total number of males from sector P and females from sector R together, we will follow these steps:
- From the graph, note the total number of employees in sectors P and R:
- Total employees in sector P = 650
- Total employees in sector R = 850 - Use the ratios from the table to find the individual counts of males and females.
The ratio for males to females in sector P is 6:7. So, the total parts = 6 + 7 = 13. - Calculate the number of males in sector P using the formula:
\(\text{Males in P} = \left(\frac{6}{13}\right) \times 650 = 300\) - Similarly, calculate the number of females in sector R. The ratio for males to females in sector R is 9:8. So, the total parts = 9 + 8 = 17.
- Calculate the number of females in sector R using the formula:
\(\text{Females in R} = \left(\frac{8}{17}\right) \times 850 = 400\) - Add the number of males in sector P and females in sector R:
\(300 + 400 = 700\)
Therefore, the total number of males from sector P and females from sector R together is 700.
Important Questions from Tabulation
- An object is placed beyond the centre of curvature (C) of a concave mirror. The image formed will be now:
Directions:
Using the data from the graph answer the question below:
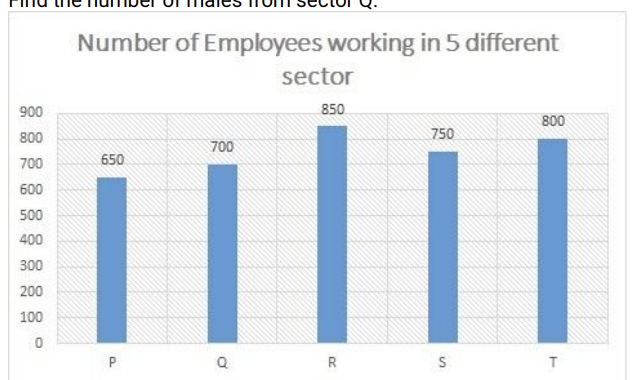
Number of Employees working in 5 different sector:
Find the number of males from sector Q.
Ratio of number of male and female employees:
Male Female P 6 7 Q 5 9 R 9 8 S 7 8 T 3 5 Directions:
Using the data from the graph answer the question below:
Find the ratio between number of males from the sector T to number of females from the sector S.
Directions:
Using the data from the graph answer the question below:
Find the total number of males from sector Q and females from sector P together.
Directions:
Study the following Bar-chart and the data provided to answer the questions that follow:
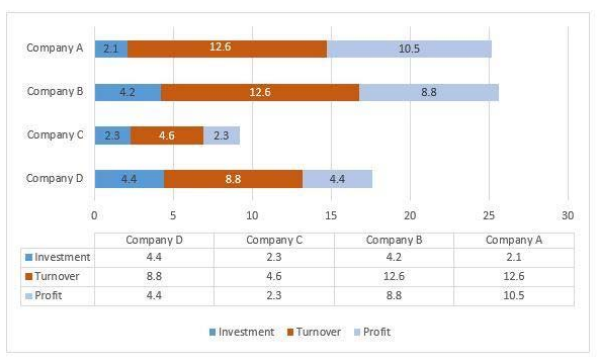
Investment, Turnover and Profit of four different companies A, B, C and D are given. (In Lakhs)
Out of the given four companies which one has highest profit proportion? (Profit proportion = Profit/Investment)