The following table shows (i) the percentage (%) distribution of number of Maruti Cars sold in six cities A-F and (ii) the proportion of three models P, Q and R among those cars sold. Total number of Maruti Cars sold in these cities is 90,000. Based on the data in the table, answer the question :City % Distribution of Sold Cars Proportion of Car Models Sold P Q R A 14.30% 7 7 4 B 16.20% 2 5 2 C 18.40% 3 3 4 D 16.80% 4 3 2 E 12.60% 2 2 1 F 21.70% 3 2 5
What is the number of Model-Q cars sold in all cities together?
31555
To determine the number of Model-Q cars sold in all the cities together, we follow these steps:
- First, note that the total number of Maruti cars sold across these six cities is 90,000.
- We have the percentage distribution of cars sold in each city. Let's calculate the actual number of cars sold per city.
| City | % Distribution | Cars Sold | Proportion of Model-Q | Model-Q Cars Sold |
|---|---|---|---|---|
| A | 14.30% | \(90,000 \times \frac{14.30}{100} = 12,870\) | 7/(7+7+4) = \(\frac{7}{18}\) | \(12,870 \times \frac{7}{18} = 5,005\) |
| B | 16.20% | \(90,000 \times \frac{16.20}{100} = 14,580\) | 5/(2+5+2) = \(\frac{5}{9}\) | \(14,580 \times \frac{5}{9} = 8,100\) |
| C | 18.40% | \(90,000 \times \frac{18.40}{100} = 16,560\) | 3/(3+3+4) = \(\frac{3}{10}\) | \(16,560 \times \frac{3}{10} = 4,968\) |
| D | 16.80% | \(90,000 \times \frac{16.80}{100} = 15,120\) | 3/(4+3+2) = \(\frac{3}{9}\) | \(15,120 \times \frac{3}{9} = 5,040\) |
| E | 12.60% | \(90,000 \times \frac{12.60}{100} = 11,340\) | 2/(2+2+1) = \(\frac{2}{5}\) | \(11,340 \times \frac{2}{5} = 4,536\) |
| F | 21.70% | \(90,000 \times \frac{21.70}{100} = 19,530\) | 2/(3+2+5) = \(\frac{2}{10}\) | \(19,530 \times \frac{2}{10} = 3,906\) |
- Sum the number of Model-Q cars sold across all cities to find the total:
- \(5,005 + 8,100 + 4,968 + 5,040 + 4,536 + 3,906 = 31,555.\)
- Therefore, the total number of Model-Q cars sold in all cities together is 31,555.
Hence, the correct answer is:
- 31555
Similar Questions
The ratio of the number of females to the number of males in City-E working in SBI, UCO and IOB together is :
The approximate percentage of the number of females with respect to the number of males across all the banks together in City-B is :
The number of females working in UCO from City-A is approximately _____ % more than the number of females working in PNB from the same city.
The total number of females working across all the six cities together is more than 1700 in :
The difference between the number of males working across all the six banks together in City-C and the number of males working across all the six banks together in City-D is :
What is the difference between Model-P cars sold in city-D and city E ?
The number of Model-P cars sold in City D is approximately _____ % of the number of Model-R cars sold in City A
What is the ratio of the number of cars sold in City C to the number of Model-Q cars sold in City D?
Number of cars sold in City F is approximately _______ % more than the number of cars sold in City B
Difference in the number of people having knowledge of C and COBOL programming language is
Important Questions from Tabulation
- An object is placed beyond the centre of curvature (C) of a concave mirror. The image formed will be now:
Directions:
Using the data from the graph answer the question below:
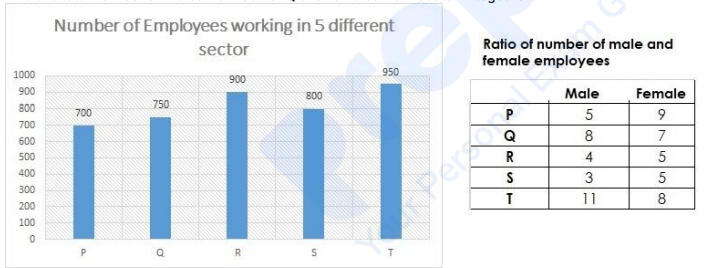
Find the total number of males from sector P and females from sector R together.
Ratio of number of male and female employees
Male Female P 6 7 Q 5 9 R 9 8 S 7 8 T 3 5 Directions:
Using the data from the graph answer the question below:
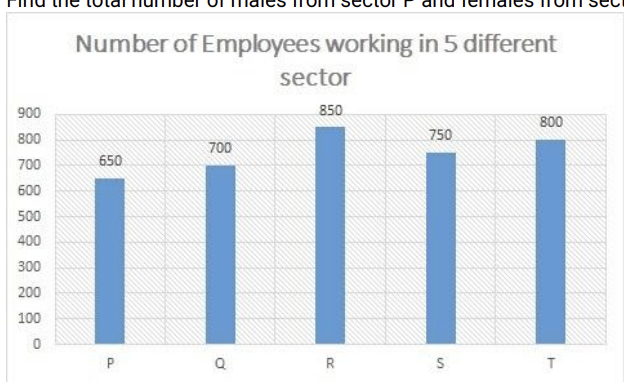
Number of Employees working in 5 different sector:
Find the number of males from sector Q.
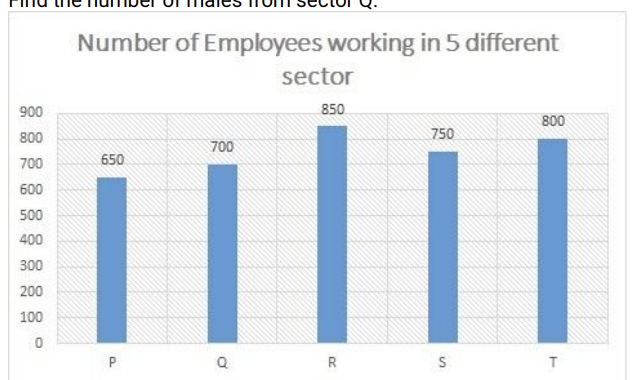
Ratio of number of male and female employees:
Male Female P 6 7 Q 5 9 R 9 8 S 7 8 T 3 5 Directions:
Using the data from the graph answer the question below:
Find the ratio between number of males from the sector T to number of females from the sector S.
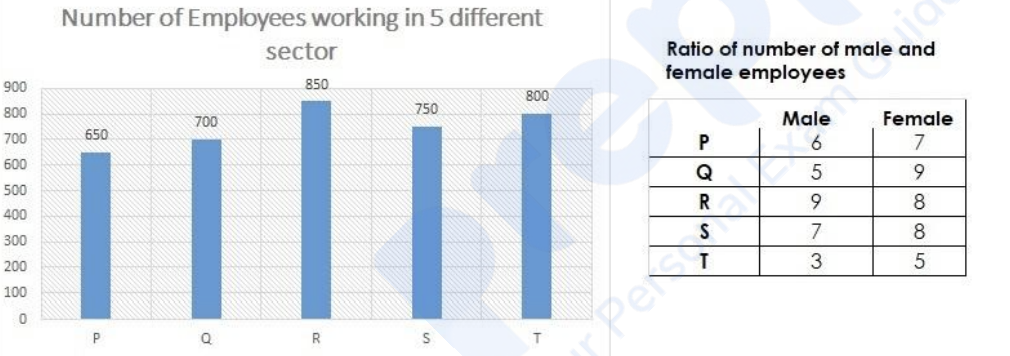
Directions:
Using the data from the graph answer the question below:
Find the total number of males from sector Q and females from sector P together.