The following table shows the number of Tourists who visit different cities by using different modes of travel. Based on the data in the table, answer the question that follows. City-wise Distribution of Tourists City Modes of Travel Car Train Bus Bike Air Delhi 19200 18800 17200 19100 17400 Mumbai 18000 16600 17800 18700 18200 Chandigarh 15600 19400 16300 18100 14800 Dehradun 13200 18500 14200 17000 14800 Manali 14900 15900 15500 14900 18300 Jaipur 16800 16400 15900 14200 17300
The number of tourists who visited Dehradun by Train is _________ % more than the number of tourists who visited Chandigarh by Air.
25
This is a percentage-comparison question, where we compare Dehradun's Train tourists with Chandigarh's Air tourists.
Tourists who visited Dehradun by Train = 18500.
Tourists who visited Chandigarh by Air = 14800.
Difference = 18500 - 14800 = 3700.
In a '% more than' question, the base value is always the quantity we are comparing against, which here is Chandigarh's Air figure (14800), not Dehradun's Train figure.
Percentage more = (Difference / Base value) x 100 = (3700 / 14800) x 100 = 25%.
Therefore, Dehradun's Train tourists are 25% more than Chandigarh's Air tourists.
Similar Questions
The ratio of the number of females to the number of males in City-E working in SBI, UCO and IOB together is :
The approximate percentage of the number of females with respect to the number of males across all the banks together in City-B is :
The number of females working in UCO from City-A is approximately _____ % more than the number of females working in PNB from the same city.
The total number of females working across all the six cities together is more than 1700 in :
The difference between the number of males working across all the six banks together in City-C and the number of males working across all the six banks together in City-D is :
What is the number of Model-Q cars sold in all cities together?
What is the difference between Model-P cars sold in city-D and city E ?
The number of Model-P cars sold in City D is approximately _____ % of the number of Model-R cars sold in City A
What is the ratio of the number of cars sold in City C to the number of Model-Q cars sold in City D?
Number of cars sold in City F is approximately _______ % more than the number of cars sold in City B
Important Questions from Tabulation
- An object is placed beyond the centre of curvature (C) of a concave mirror. The image formed will be now:
Directions:
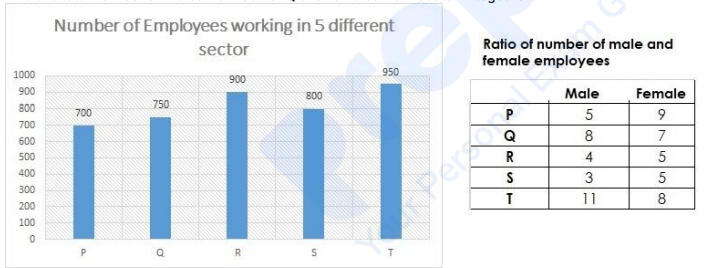
Using the data from the graph answer the question below:
Find the total number of males from sector P and females from sector R together.
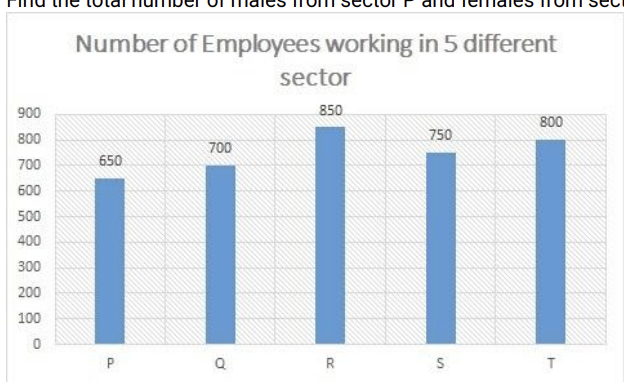
Ratio of number of male and female employees
Male Female P 6 7 Q 5 9 R 9 8 S 7 8 T 3 5 Directions:
Using the data from the graph answer the question below:
Number of Employees working in 5 different sector:
Find the number of males from sector Q.
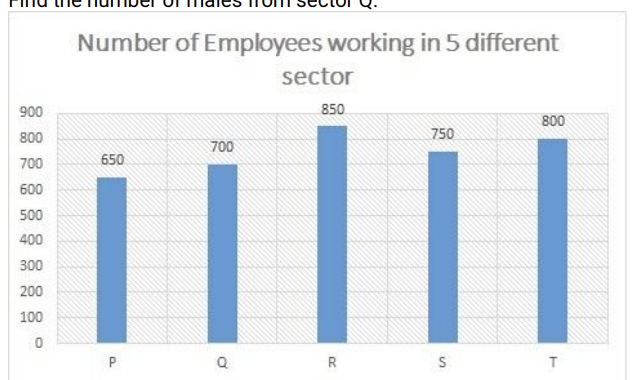
Ratio of number of male and female employees:
Male Female P 6 7 Q 5 9 R 9 8 S 7 8 T 3 5 Directions:
Using the data from the graph answer the question below:
Find the ratio between number of males from the sector T to number of females from the sector S.
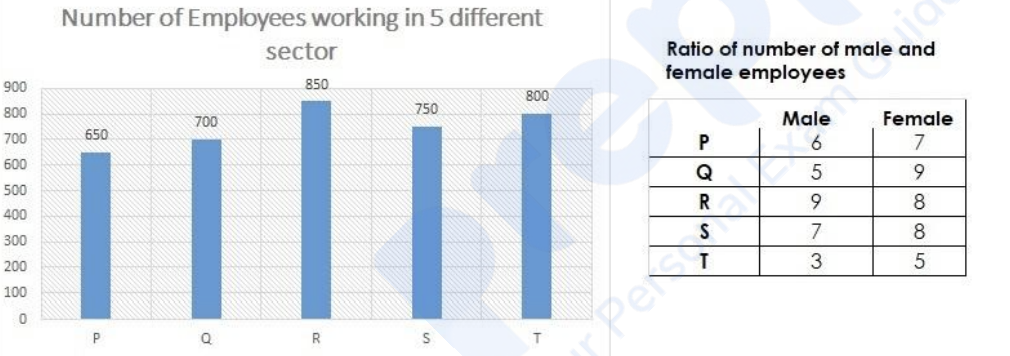
Directions:
Using the data from the graph answer the question below:
Find the total number of males from sector Q and females from sector P together.