
The monthly expenditure of a person is Rs. 6,000. The distribution of expenditure on various items is as follows: Item of expenditure Amount (in Rs.) 1. Food 2,000 2. Clothing 660 3. Fuel and rent 1,200 4. Education 480 5. Miscellaneous 1,660
1.2 cm and 4.15 cm
Understanding Monthly Expenditure Data Representation
The problem provides the monthly expenditure of a person, which totals Rs. 6,000. This expenditure is distributed across different items like Food, Clothing, Fuel and rent, Education, and Miscellaneous. We are given the amount spent on each item.
The data is to be represented using a percentage bar diagram with a total height of 15 cm. In a percentage bar diagram, the total height of the bar represents 100% of the total expenditure, and the length of each segment within the bar corresponds to the percentage share of the respective expenditure item.
The given distribution is as follows:
| Item of expenditure | Amount (in Rs.) |
| 1. Food | 2,000 |
| 2. Clothing | 660 |
| 3. Fuel and rent | 1,200 |
| 4. Education | 480 |
| 5. Miscellaneous | 1,660 |
First, let's verify the total expenditure from the given amounts:
Total Expenditure \(= 2000 + 660 + 1200 + 480 + 1660 = 6000\) Rs.
This matches the given total monthly expenditure.
Calculating Percentage Expenditure for Each Item
To determine the length of each segment in the percentage bar diagram, we need to calculate the percentage of expenditure for each item relative to the total expenditure of Rs. 6,000.
The formula for percentage is: \(\text{Percentage} = \left( \frac{\text{Amount spent on item}}{\text{Total Expenditure}} \right) \times 100\)%
- Food: \(\left( \frac{2000}{6000} \right) \times 100\% = \left( \frac{1}{3} \right) \times 100\% \approx 33.33\%\)
- Clothing: \(\left( \frac{660}{6000} \right) \times 100\% = \left( \frac{66}{600} \right) \times 100\% = \left( \frac{11}{100} \right) \times 100\% = 11\%\)
- Fuel and rent: \(\left( \frac{1200}{6000} \right) \times 100\% = \left( \frac{12}{60} \right) \times 100\% = \left( \frac{1}{5} \right) \times 100\% = 20\%\)
- Education: \(\left( \frac{480}{6000} \right) \times 100\% = \left( \frac{48}{600} \right) \times 100\% = \left( \frac{8}{100} \right) \times 100\% = 8\%\)
- Miscellaneous: \(\left( \frac{1660}{6000} \right) \times 100\% = \left( \frac{166}{600} \right) \times 100\% = \left( \frac{83}{300} \right) \times 100\% \approx 27.67\%\)
Let's check the sum of percentages: \(33.33\% + 11\% + 20\% + 8\% + 27.67\% = 100\%\) (approximately, due to rounding for Food and Miscellaneous, but the exact fractions sum to 1). Using fractions or exact decimals for calculation is better for precision.
- Education percentage: \(\frac{480}{6000} = \frac{48}{600} = \frac{8}{100} = 0.08\) or 8%
- Miscellaneous percentage: \(\frac{1660}{6000} = \frac{166}{600} = \frac{83}{300}\) or approximately 27.67%
Calculating Segment Lengths in the Bar Diagram
The total height of the percentage bar diagram is 15 cm, representing 100% of the expenditure.
To find the length of the segment for a specific item, we multiply the total height by the percentage share of that item (expressed as a decimal or fraction).
Length of segment = (Percentage share / 100) \(\times\) Total height of bar
- Length of the segment corresponding to Education:
Education percentage is 8% or 0.08.
Length for Education \(= 0.08 \times 15 \text{ cm} = 1.20 \text{ cm}\)
- Length of the segment corresponding to Miscellaneous:
Miscellaneous percentage is \(\frac{1660}{6000} = \frac{166}{600}\). Expressing this as a decimal: \(\frac{166}{600} \approx 0.27666...\)
Length for Miscellaneous \(= \frac{1660}{6000} \times 15 \text{ cm} = \frac{166}{600} \times 15 \text{ cm} = \frac{166 \times 15}{600} \text{ cm}\)
Simplify the fraction: \(\frac{166 \times 15}{600} = \frac{166 \times 1}{40} = \frac{83 \times 1}{20} = \frac{83}{20} \text{ cm}\)
Converting the fraction to a decimal: \(\frac{83}{20} = 4.15 \text{ cm}\)
So, the length of the segment for Education is 1.2 cm, and the length of the segment for Miscellaneous is 4.15 cm.
Summary of Segment Lengths
- Education segment length: 1.2 cm
- Miscellaneous segment length: 4.15 cm
These values correspond to the lengths of the two segments requested in the question, corresponding to education and miscellaneous respectively.
Revision Table: Monthly Expenditure Analysis
| Item | Amount (Rs.) | Percentage Share (%) | Segment Length (cm) [Height = 15 cm] |
| Food | 2000 | \(\frac{2000}{6000} \times 100 = 33.33\) | \(0.3333 \times 15 \approx 5.00\) |
| Clothing | 660 | \(\frac{660}{6000} \times 100 = 11\) | \(0.11 \times 15 = 1.65\) |
| Fuel and rent | 1200 | \(\frac{1200}{6000} \times 100 = 20\) | \(0.20 \times 15 = 3.00\) |
| Education | 480 | \(\frac{480}{6000} \times 100 = 8\) | \(0.08 \times 15 = 1.20\) |
| Miscellaneous | 1660 | \(\frac{1660}{6000} \times 100 = 27.67\) | \(0.2767 \times 15 \approx 4.15\) |
| Total | 6000 | 100 | \(5.00 + 1.65 + 3.00 + 1.20 + 4.15 = 15.00\) |
The calculated segment lengths for Education (1.2 cm) and Miscellaneous (4.15 cm) match one of the provided options.
Additional Information: Percentage Bar Diagrams
A percentage bar diagram is a type of bar diagram where a single bar is divided into segments, each representing a percentage of the total. The total height or length of the bar represents 100%.
- They are useful for visually comparing the proportions of different categories within a whole.
- Unlike simple bar diagrams which compare absolute values, percentage bar diagrams focus on relative contributions.
- The segments are stacked one above the other to form the total bar.
- Other data representation methods include simple bar diagrams, multiple bar diagrams, component bar diagrams (similar to percentage bar diagrams but using actual values or counts rather than percentages), pie charts, histograms, frequency polygons, and ogives.
- Pie charts also represent parts of a whole, but they use sectors of a circle rather than segments of a bar. The angle of each sector in a pie chart is proportional to the percentage share of the category (\(\text{Angle} = \frac{\text{Percentage share}}{100} \times 360^\circ\)).
- Choosing the right type of diagram depends on the data and what aspect you want to highlight (absolute values vs. proportions, comparison over time, frequency distribution, etc.).
Similar Questions
The percentage increase in the total production of cars from 2014 to 2018 was
Consider the production of each company separately. In how many instances was the percentage increase in production of cars over the previous year’s production greater than 20% ?
In which year was the percentage increase in production of cars minimum as compared to its previous year ?
In one of the years the percentage increase in production of cars was minimum as compared to its previous year. What was the minimum percentage ?
Important Questions from Bar Graph
Sales of books from four shops (B1, B2, B3, B4) in thousands are given as below. Study the graph and answer the following questions.
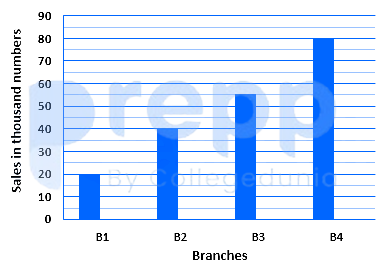
If each shop can increases the sales of books by 10%,then the total number of books(in thousands) soldby all the shop are:
The given pie chart shows the degree-wise break-up of the expenditure of a family in a month. The total expenditure of the family is ₹43,200.
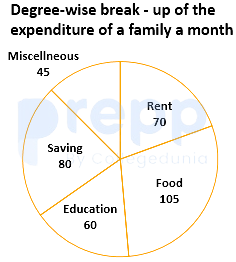
By what percentage is the expenditure on education and rent taken together more than the expenditure on food (correct to two decimal places)?
Which country has the second largest population density?
For the second show the number of audience in Screen 3 is how much more than the number of audience in Screen 1?
The percentage increase in the total production of cars from 2014 to 2018 was



