
The following Bar-Chart gives the production of cars by three different companies X, Y and Z in different years: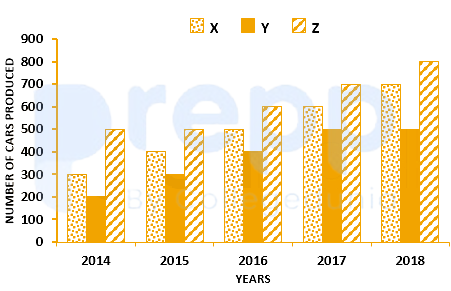
In which year was the percentage increase in production of cars minimum as compared to its previous year ?
2018
From the bar graph,
Total Production of car in 2014 = 300 + 200 + 500 = 1000
Total Production of car in 2015 = 400 + 300 + 500 = 1200
Percentage of production increase of from 2014 to 2015 = (200/1000) × 100 = 20%
Total Production of car in 2016 = 500 + 400 + 600 = 1500
Percentage of production increase of from 2015 to 2016 = (400/1100) × 100 = 400/11 %
Total Production of car in 2017 = 600 + 500 + 700 = 1800
Percentage of production increase of from 2016 to 2017 = (300/1500) × 100 = 20%
Total Production of car in 2018 = 700 + 500 + 800 = 2000
Percentage of production increase of from 2017 to 2018 = (200/1800) × 100 = 11.11%
∴ The percentage increase in production of cars minimum as compared to its previous year in 2018.
Similar Questions
The percentage increase in the total production of cars from 2014 to 2018 was
Consider the production of each company separately. In how many instances was the percentage increase in production of cars over the previous year’s production greater than 20% ?
In one of the years the percentage increase in production of cars was minimum as compared to its previous year. What was the minimum percentage ?
The monthly expenditure of a person is Rs. 6,000. The distribution of expenditure on various items is as follows:
If the above data is represented by a percentage bar diagram of height 15 cm, then what are the lengths of the two segments of the bar diagram corresponding to education and miscellaneous respectively?Item of expenditure
Amount (in Rs.)
1. Food
2,000
2. Clothing
660
3. Fuel and rent
1,200
4. Education
480
5. Miscellaneous
1,660
Important Questions from Bar Graph
Sales of books from four shops (B1, B2, B3, B4) in thousands are given as below. Study the graph and answer the following questions.
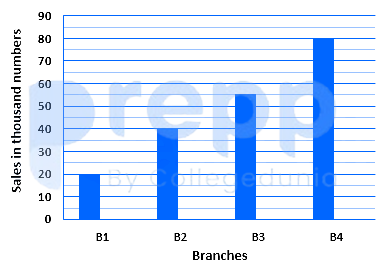
If each shop can increases the sales of books by 10%,then the total number of books(in thousands) soldby all the shop are:
The given pie chart shows the degree-wise break-up of the expenditure of a family in a month. The total expenditure of the family is ₹43,200.
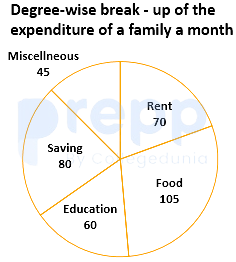
By what percentage is the expenditure on education and rent taken together more than the expenditure on food (correct to two decimal places)?
Which country has the second largest population density?
For the second show the number of audience in Screen 3 is how much more than the number of audience in Screen 1?
The percentage increase in the total production of cars from 2014 to 2018 was



