All Exams Test series for 1 year @ ₹349 only
Question

The following table shows the number of students in different streams in 5 departments. Study the table carefully and answer the question based on the table.

Stream

DEPARTMENT

A

B

C

D

E

Physics

400

500

350

300

600

Chemistry

750

600

700

500

450

Mathematics

350

400

450

500

750

Computer Science

250

300

380

550

600

Which department has the maximum number of students in all streams?

The correct answer is

E

Finding the Department with Maximum Students

The question asks us to identify which department among the five (A, B, C, D, and E) has the highest total number of students when considering all the listed streams: Physics, Chemistry, Mathematics, and Computer Science.

To find the department with the maximum number of students, we need to calculate the total number of students in each department by summing up the students in all four streams for that specific department. We will use the data provided in the table.

Stream DEPARTMENT A DEPARTMENT B DEPARTMENT C DEPARTMENT D DEPARTMENT E
Physics 400 500 350 300 600
Chemistry 750 600 700 500 450
Mathematics 350 400 450 500 750
Computer Science 250 300 380 550 600

Calculating Total Students per Department

We will now calculate the total number of students for each department by adding the student counts across all streams:

  • Department A Total: Sum of students in Physics, Chemistry, Mathematics, and Computer Science in Department A.
  • Calculation for Department A: \(400 + 750 + 350 + 250 = 1750\) students.
  • Department B Total: Sum of students in Physics, Chemistry, Mathematics, and Computer Science in Department B.
  • Calculation for Department B: \(500 + 600 + 400 + 300 = 1800\) students.
  • Department C Total: Sum of students in Physics, Chemistry, Mathematics, and Computer Science in Department C.
  • Calculation for Department C: \(350 + 700 + 450 + 380 = 1880\) students.
  • Department D Total: Sum of students in Physics, Chemistry, Mathematics, and Computer Science in Department D.
  • Calculation for Department D: \(300 + 500 + 500 + 550 = 1850\) students.
  • Department E Total: Sum of students in Physics, Chemistry, Mathematics, and Computer Science in Department E.
  • Calculation for Department E: \(600 + 450 + 750 + 600 = 2400\) students.

Comparing Department Total Students

Now we compare the total number of students calculated for each department:

  • Department A: 1750
  • Department B: 1800
  • Department C: 1880
  • Department D: 1850
  • Department E: 2400

Comparing these totals, we can see that Department E has the highest number of students (2400).

Conclusion: Department with Maximum Students

Based on our calculations, Department E has the maximum number of students across all streams.

Department Total Students
A 1750
B 1800
C 1880
D 1850
E 2400

Therefore, Department E has the maximum number of students in all streams.

Revision Table: Key Data Analysis Concepts

When working with tables and data analysis questions like this, remember these key steps:

  • Understand the question: Clearly identify what is being asked (e.g., total, average, difference, maximum, minimum).
  • Read the table carefully: Identify the rows, columns, and what the data represents.
  • Perform necessary calculations: This might involve summing, averaging, finding differences, or percentages based on the question.
  • Compare values: If the question asks for maximum, minimum, or comparison, list the calculated values and find the required one.
  • State the answer clearly: Relate the result back to the original question and the data provided.

Additional Information: Types of Data Analysis Questions

Questions based on data tables often test your ability to quickly extract and process information. Common question types include:

  • Finding totals: Summing values across rows or columns.
  • Calculating averages: Finding the mean of a set of values.
  • Determining differences: Finding the difference between two values or totals.
  • Calculating percentages: Finding a value as a percentage of another value or total.
  • Identifying maximum or minimum values: Finding the highest or lowest number in a set or calculated total.
  • Ratio and proportion: Comparing values using ratios.

Practicing these types of calculations using different tables can improve your speed and accuracy.

Was this answer helpful?

Important Questions from Data Interpretation

  1. The table given below shows the earnings of two persons on five different days.

    Earnings
    Days PQ
    Monday105150
    Tuesday96110
    Wednesday65122
    Thursday115106
    Friday13068
    What is the ratio of total earnings of P to the total earnings of Q? 
  2. The table below shows the number of toys of 6 different colours sold from a shop during a given period. The table also shows the percentage of toys of each colour which are cars.

    ColourTotal toysPercentage of cars
    C150012
    C260015
    C340012.5
    C455010
    C565020
    C645010

    What is the total number of car toys of C2 and C3 taken together?

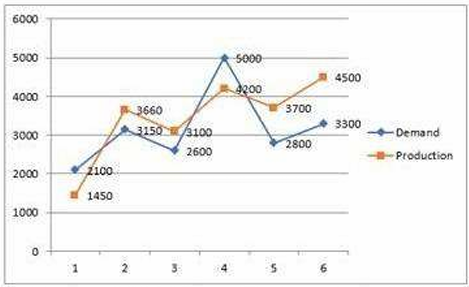
  3. Study the given graph carefully and answer the question that follows. The graph shows the demand and production of different companies.

    The ratio between the companies having more production than demand and more demand than production is:
  4. Study the given table and answer the question that follows. The given table shows the number of new employees added to different categories of employees in a company for four years and the number of employees from these categories who left the company every year.
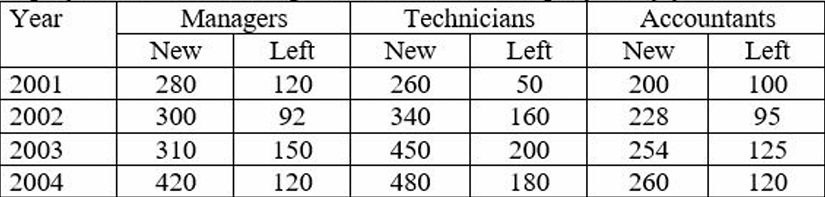
     

    During the period between 2001 and 2004, the total number of Technicians who left the Company is what percentage (rounded off to the nearest integer) of the total number of Technicians who joined the Company?

  5. The given pie-chart shows the percentage distribution of 20,000 employees in a company. Study the given chart and answer the question that follows. If 30% of the employees in department D are females, then how many male employees are there in that department?

Need Expert Advice?

Start Your Preparation with Prepp Mobile App

Download the app from Google Play & App Store
Prepp Mobile App