Study the given graph and answer the question that follows.
The graph shows the total cost and sales values (in lakhs) of five products manufactured by a company.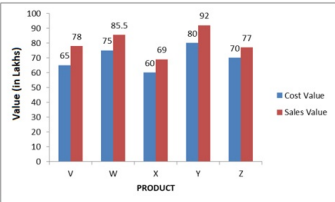
In which product has the company earned maximum profit?
Understanding Product Profit Calculation
Profit for a product is determined by subtracting its total cost value from its total sales value. The formula is:
$ \text{Profit} = \text{Sales Value} - \text{Cost Value} $
We need to calculate the profit for each of the five products (V, W, X, Y, Z) shown in the graph data.
Calculating Profit for Each Product
The costs and sales values are given in lakhs. Let's calculate the profit for each product:
| Product | Cost Value (lakhs) | Sales Value (lakhs) | Calculated Profit (lakhs) |
|---|---|---|---|
| V | 65 | 78 | $78 - 65 = 13$ |
| W | 60 | 85.5 | $85.5 - 60 = 25.5$ |
| X | 75 | 69 | $69 - 75 = -6$ (Loss) |
| Y | 80 | 92 | $92 - 80 = 12$ |
| Z | 70 | 77 | $77 - 70 = 7$ |
Identifying Maximum Profit Product
By comparing the calculated profits for all products:
- Product V: Profit = 13 lakhs
- Product W: Profit = 25.5 lakhs
- Product X: Profit = -6 lakhs (Loss)
- Product Y: Profit = 12 lakhs
- Product Z: Profit = 7 lakhs
The highest profit among all products is 25.5 lakhs.
Therefore, Product W has earned the maximum profit.
Similar Questions
- In which state was the annual rainfall (in cm) for 2005 greater than the average annual rainfall (in cm) for all three years?
- Which state has the maximum percentage decrease in annual rainfall between the years 2000 and 2015?
- Which state has maximum percentage change in the production of grains between the year 2015 and 2018?
- In which year did the production fall the most as compared to the previous year, in offshore production?
- What is the approximate percentage decline in offshore production in the year 2013-14?
- What is the total onshore production during all the years (in BCM)?
- Which of the following years showed the highest growth rate in onshore production?
- Study the given table and answer the question that follows.
The number of cycles produced in a factory during five consecutive weeks is given in the table.Week First Second Third Fourth Fifth Number of cycles produced 800 1360 1000 900 1400
If the factory had produced the same number of cycles in all 5 weeks as they produced in the week with the maximum production, how many additional cycles would the factory have produced? - Study the given table and answer the question that follows.
Institution Girls Boys Teachers School 3000 2500 690 College 9000 11000 1500 University 15000 16000 2000
What is the ratio of college teachers to school girls? - Study the given table and answer the question that follows.
The information related to the sale (in rupees) of different items of a baker's shop in one day is given in the table.Items Ordinary bread Fruit bread Cakes and pastries Biscuits Others Sales (in rupees) 400 320 210 120 100 Customers 40 16 14 12 4
What would be the maximum amount of increase in sales for the baker, if all customers who bought any type of bread would ALSO have bought either Cakes and Pastries OR biscuits?
Important Questions from Tabulation
What is the ratio of total number of patients recovered from covid-19 in April to total number of patients recovered from covid-19 in March?
In which state, the number of patients who recovered from covid-19 steadily decreasing?
What is the average number of patients who recovered from Covid-19 in Madhya Pradesh in four months?
Find the difference between the total number of patients recovered from Covid-19 in all months in Punjab and the total number of patients recovered from Covid-19 in all months in Rajasthan.
In February 2021 the number of patients recovered from Covid-19 in Punjab is how much approximant percent more/less than the number of patients recovered from Covid-19 Uttar Pradesh in the same month?