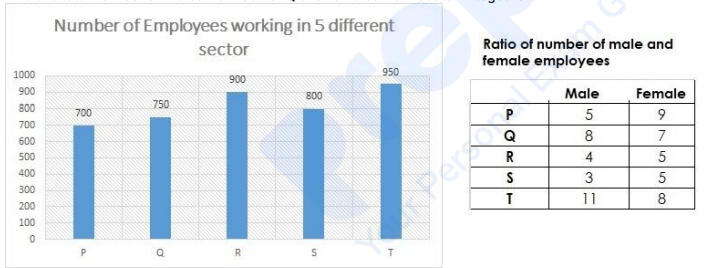
The following table presents the details about the number of software development projects handled by two software companies A and B over five years from 2016 to 2020. Both the companies are engaged in handling both Government Projects (GPs) as well as Non-Governmental Projects (NGPs). Based on the data in the table, answer the question that follows. Year-wise handling of Projects Year Software Company A B 2016 180 130 2017 230 320 2018 360 210 2019 250 190 2020 300 350
If the number of projects to be handled by Company A will increase by 20% from 2020 to 2021 and by 5% from 2021 to 2022, then what will be the number of projects to be handled by Company A in 2022?
378
Company A handled 300 projects in 2020.
Projects in 2021 = 300 × 1.20 = 360.
Projects in 2022 = 360 × 1.05 = 378.
Similar Questions
The ratio of the number of females to the number of males in City-E working in SBI, UCO and IOB together is :
The approximate percentage of the number of females with respect to the number of males across all the banks together in City-B is :
The number of females working in UCO from City-A is approximately _____ % more than the number of females working in PNB from the same city.
The total number of females working across all the six cities together is more than 1700 in :
The difference between the number of males working across all the six banks together in City-C and the number of males working across all the six banks together in City-D is :
What is the number of Model-Q cars sold in all cities together?
What is the difference between Model-P cars sold in city-D and city E ?
The number of Model-P cars sold in City D is approximately _____ % of the number of Model-R cars sold in City A
What is the ratio of the number of cars sold in City C to the number of Model-Q cars sold in City D?
Number of cars sold in City F is approximately _______ % more than the number of cars sold in City B
Important Questions from Tabulation
- An object is placed beyond the centre of curvature (C) of a concave mirror. The image formed will be now:
Directions:
Using the data from the graph answer the question below:
Find the total number of males from sector P and females from sector R together.
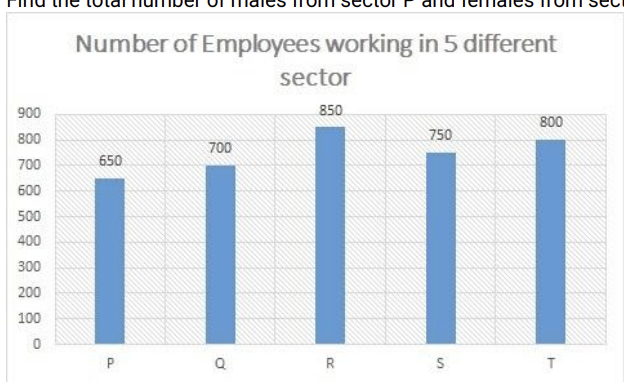
Ratio of number of male and female employees
Male Female P 6 7 Q 5 9 R 9 8 S 7 8 T 3 5 Directions:
Using the data from the graph answer the question below:
Number of Employees working in 5 different sector:
Find the number of males from sector Q.
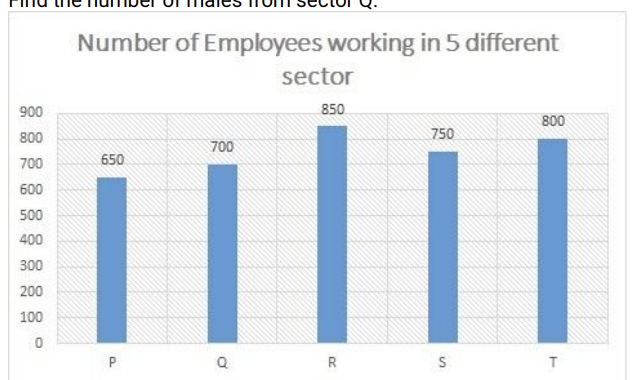
Ratio of number of male and female employees:
Male Female P 6 7 Q 5 9 R 9 8 S 7 8 T 3 5 Directions:
Using the data from the graph answer the question below:
Find the ratio between number of males from the sector T to number of females from the sector S.
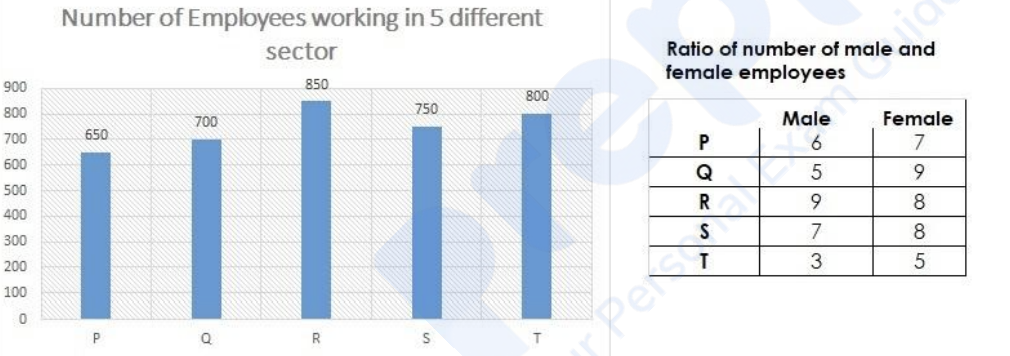
Directions:
Using the data from the graph answer the question below:
Find the total number of males from sector Q and females from sector P together.