The table below presents the percentage profit earned by two companies A and B during the period 2013 to 2018. Based on the data given in the table, answer five questions that follow Yearwise percentage (%) profit [Where profit % = $\frac{Income − Expenditure}{Expenditure} × 100]$Year % Profit Earned A B 2013 20 % 35 % 2014 32 % 30 % 2015 40 % 50 % 2016 25 % 40 % 2017 30 % 30 % 2018 15 % 40 %
If the income of company A in the year 2017 is ₹ 26 lakhs, then what is the expenditure of company A in that year?
₹ 20.0 lakhs
Solution:
To solve this question, we need to determine the expenditure of company A in the year 2017, given its income and percentage profit for that year. Let's go through the steps one by one.
Given Data:
- Income of company A in 2017 = ₹ 26 lakhs
- Percentage profit of company A in 2017 = 30%
Formula Used:
The formula for percentage profit is:
\(\text{Profit \%} = \frac{\text{Income} - \text{Expenditure}}{\text{Expenditure}} \times 100\)
Solution Steps:
- Let the expenditure of company A in 2017 be ₹ \(E\)lakhs.
- According to the formula given for profit percentage:
30 = \frac{26 - E}{E} \times 100
- Re-arrange the equation to find \(E\):
\frac{26 - E}{E} = \frac{30}{100}
- Cross-multiply to solve for \(E\):
26 - E = \frac{30}{100} \times E
- Convert the equation to:
26 - E = 0.3E
- Combine the \(E\)terms:
26 = E + 0.3E
- Simplify to:
26 = 1.3E
- Isolate \(E\):
E = \frac{26}{1.3} = 20 \text{ lakhs}
Conclusion:
The expenditure of company A in the year 2017 is ₹ 20.0 lakhs.
Verification:
To ensure correctness, verify by substituting back:
- Income = ₹ 26 lakhs, Expenditure = ₹ 20 lakhs.
- Profit = Income - Expenditure = ₹ 26 lakhs - ₹ 20 lakhs = ₹ 6 lakhs.
- Profit Percentage = \(\frac{6}{20} \times 100 = 30\%\).
The calculated profit percentage matches the given data, confirming the solution is correct.
Similar Questions
The ratio of the number of females to the number of males in City-E working in SBI, UCO and IOB together is :
The approximate percentage of the number of females with respect to the number of males across all the banks together in City-B is :
The number of females working in UCO from City-A is approximately _____ % more than the number of females working in PNB from the same city.
The total number of females working across all the six cities together is more than 1700 in :
The difference between the number of males working across all the six banks together in City-C and the number of males working across all the six banks together in City-D is :
What is the number of Model-Q cars sold in all cities together?
What is the difference between Model-P cars sold in city-D and city E ?
The number of Model-P cars sold in City D is approximately _____ % of the number of Model-R cars sold in City A
What is the ratio of the number of cars sold in City C to the number of Model-Q cars sold in City D?
Number of cars sold in City F is approximately _______ % more than the number of cars sold in City B
Important Questions from Tabulation
- An object is placed beyond the centre of curvature (C) of a concave mirror. The image formed will be now:
Directions:
Using the data from the graph answer the question below:
Find the total number of males from sector P and females from sector R together.
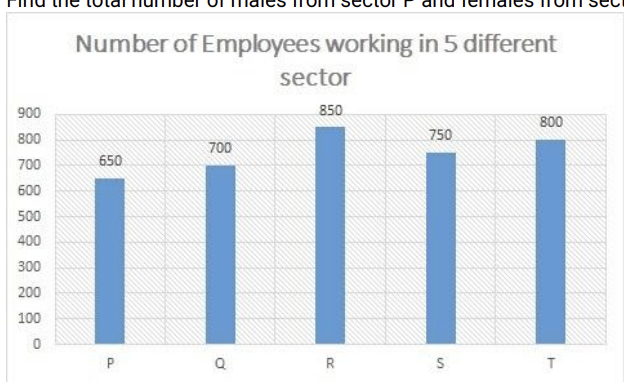
Ratio of number of male and female employees
Male Female P 6 7 Q 5 9 R 9 8 S 7 8 T 3 5 Directions:
Using the data from the graph answer the question below:
Number of Employees working in 5 different sector:
Find the number of males from sector Q.
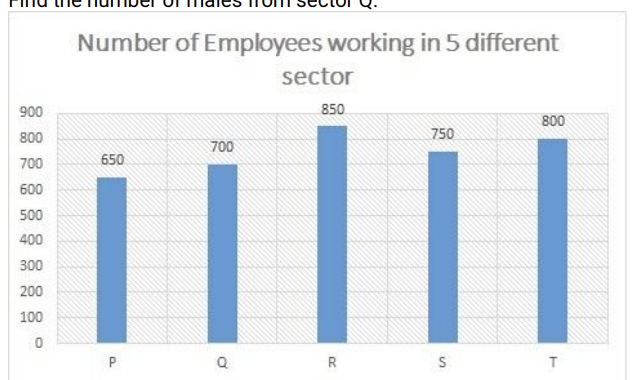
Ratio of number of male and female employees:
Male Female P 6 7 Q 5 9 R 9 8 S 7 8 T 3 5 Directions:
Using the data from the graph answer the question below:
Find the ratio between number of males from the sector T to number of females from the sector S.
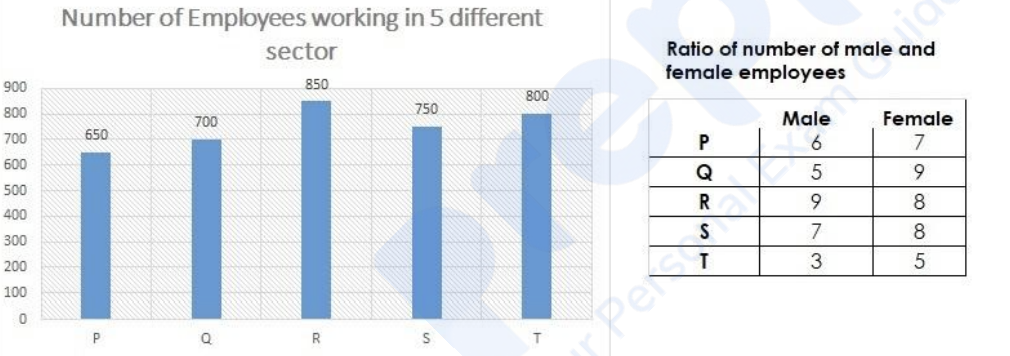
Directions:
Using the data from the graph answer the question below:
Find the total number of males from sector Q and females from sector P together.