
Which one of the following diagrams represents the relationship between Insects, Flies and Dogs?

Flies are a subset of insects. Dogs are completely separate from insects. The correct diagram shows Flies inside the Insects circle, and the Insects and Dogs circles are disjoint (not overlapping). This accurately represents the hierarchical and non-overlapping relationship between these three groups. Insects is the broadest category, containing Flies as a subcategory. Dogs belong to a completely different biological classification.
Similar Questions
Identify the diagram that best represents the relationship among classes given below: Universe, Stars, Sun
Which of the following diagram represents the relationship among Tall men, Black haired, Indians?
Identify the diagram that best represents the relationship among classes given below: Men, Rodents and living beings
In a village some of the goldsmiths are literates. Which diagram shows literate goldsmiths?
Identify the diagram that best represents the relationship among classes given below
Minutes, Days, Months.
Consider the given statement/s to be true and decide which of the given conclusions/assumptions can definitely be drawn from the given statement.
Statement:
I. Nutritious food is delicious and good for health
II. Honey is nutritious.
Conclusions:
I. Honey is good for health.
II. Delicious foods are nutritious.
Identify the diagram that best represents the relationship among classes given below: North America, United States of America, New York.
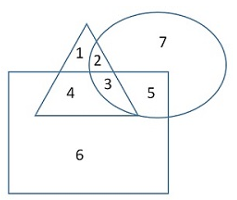
In the given figure, triangle represents the healthy, square represents the old, and circle represents the men. Find out the area of the figure which represents the “men who are healthy but not old”.
Which of the answer figures best represents the relation between: Shirt, Garments, Clothes
Identify the diagram that best represents the relationship among classes given below:
Professors, post graduates & employed
Important Questions from Venn Diagram
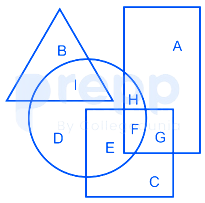
In the following figure, square represents Priests, triangle represents singers, circle represents Therapists and rectangle represents Indians. Which set of of letters represents Indians who are not priests?
Study the given diagram carefully and answer the question. The numbers in different sections indicate the number of persons.
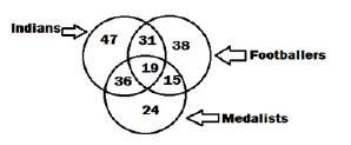
How many such medallists are there who are also Indians?
Study the given diagram carefully and answer the question. The numbers in different sections indicate the number of persons.
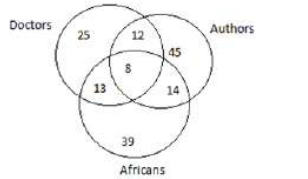
How many Africans are there who are also authors?
Identify the diagram that best represents the relationship among classes given below: Universe, Stars, Sun
Which of the following diagram represents the relationship among Tall men, Black haired, Indians?



