
Which figure best represents the relation among Fathers, Teacher, Males?
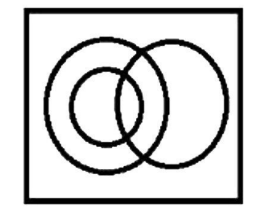
To solve the given problem, we need to determine the correct diagram that represents the relationship among the groups: Fathers, Teachers, and Males. Let's analyze each set:
- Fathers: All fathers are males, so they form a subset of males.
- Teachers: Teachers can be of any gender, meaning they can include males and females. Thus, teachers may have some overlap with males but are not contained within them.
- Males: This group consists of all male individuals, whether they are fathers, teachers, or neither.
We need a diagram where:
- The circle representing fathers is entirely within the circle representing males since all fathers are male.
- The circle for teachers should overlap with the males, as some teachers can be male, but it shouldn't be completely within the male category because there are female teachers as well.
Based on the description, the correct representation is the one where:
- One circle for males.
- Another circle for fathers completely inside the male circle.
- And a separate (overlapping) circle for teachers intersecting the male circle but not fully enclosed by it.
The following diagram correctly represents this relationship:
This diagram correctly shows that:
- All fathers are males (fathers circle is inside male).
- Teachers intersect with males, showing male teachers, but also exist independently, indicating that some teachers are not male.
Therefore, the correct answer is the diagram shown above.
Similar Questions
Select the Venn diagram that best illustrates the relationship among the following classes.
Neptune, Planet, Moon
Select the Venn diagram that best represents the relationship between the following.
India, Delhi, Assam, Guwahati
Select the set of classes, the relationship among which is best illustrated by the following Venn diagram.

Select the Venn diagram that best illustrates the relationship between the following classes.
Clothes, Shirts, Linen
Clothes = C
Shirts = S
Linen = L
Select the Venn diagram that best illustrates the relationship between the following classes.
Dubai, Asia, Africa
Select the Venn diagram that best illustrates the relationship between the following classes.
Planets, Mars, Venus
Select the Venn diagram that best represents the relationship among the following classes.
Electronic gadgets, Mobile phones, Table, Laptops
Select the Venn diagram that best represents the relationship between the following.
Human, Teacher, Clerk, Peon
Select the Venn diagram that best represents the relationship between the following.
Living organisms, Omnivores, Deer, Planet
Which of the following Venn diagrams best represents the relationship between the following classes?
Accountants, Girls, Internet users
Important Questions from Logical Venn Diagram
Select the Venn diagram that best illustrates the relationship among the following classes.
Neptune, Planet, Moon
Select the Venn diagram that best represents the relationship between the following.
India, Delhi, Assam, Guwahati
Select the set of classes, the relationship among which is best illustrated by the following Venn diagram.
Teacher, College, Student –
Cabinet, Home Minister, Minister –



