
$CH_3CH_2CH_2OCH_3$
Understanding NMR Splitting and Field Dependence
Proton NMR spectroscopy ($^1H$ NMR) splitting patterns can change with the magnetic field strength (spectrometer frequency). This phenomenon occurs when the chemical shift difference between coupled protons (in Hz) is comparable to their coupling constant ($J$). This is often referred to as second-order effects.
Analyzing Methyl Propyl Ether ($CH_3CH_2CH_2OCH_3$)
The molecule is methyl propyl ether: $CH_3^a CH_2^b CH_2^c OCH_3^d$. We need to identify the protons whose splitting patterns differ significantly between low field ($60$ MHz) and high field ($500$ MHz).
Key parameters influencing splitting patterns include:
- Chemical shifts ($\delta$ in ppm)
- Coupling constants ($J$ in Hz)
- Spectrometer frequency ($\nu_0$ in MHz)
The chemical shift difference in Hz is calculated as $ \Delta\nu = \nu_0 \times |\delta_1 - \delta_2| $. A common criterion for distinguishing first-order ($ \Delta\nu \gg J $) from second-order ($ \Delta\nu \lesssim J $) effects is the ratio $ \Delta\nu / J $. Ratios significantly greater than 10 suggest first-order behavior, while ratios near or below 1 indicate strong second-order effects.
Comparing Splitting Patterns at Different Field Strengths
Let's analyze the protons based on typical values:
- $ \delta_a \approx 0.9 $ ppm, $ \delta_b \approx 1.6 $ ppm, $ \delta_c \approx 3.4 $ ppm, $ \delta_d \approx 3.3 $ ppm
- Typical vicinal couplings: $ J_{ab} \approx J_{bc} \approx J_{cd} \approx 7 $ Hz
| Protons | Coupling | $ \Delta\delta $ (ppm) | $ \Delta\nu $ (60 MHz) | $ \Delta\nu / J $ (60 MHz) | $ \Delta\nu $ (500 MHz) | $ \Delta\nu / J $ (500 MHz) | Observation |
|---|---|---|---|---|---|---|---|
| a & b | $ J_{ab} $ | 0.7 | 42 Hz | $ 42 / 7 = 6 $ | 350 Hz | $ 350 / 7 = 50 $ | Pattern relatively consistent (near first-order) |
| b & c | $ J_{bc} $ | 1.8 | 108 Hz | $ 108 / 7 \approx 15.4 $ | 900 Hz | $ 900 / 7 \approx 128 $ | Pattern simplifies at higher field |
| c & d | $ J_{cd} $ | 0.1 | 6 Hz | $ 6 / 7 < 1 $ | 50 Hz | $ 50 / 7 \approx 7.1 $ | Significant change: Strong second-order to near first-order |
Reasoning for Different Splitting Patterns
The protons labeled 'c' ($CH_2$ adjacent to oxygen) exhibit the most significant change in splitting pattern.
- At 60 MHz, the chemical shift difference between protons 'c' and protons 'd' ($ \Delta\nu_{cd} = 6 $ Hz) is less than the coupling constant ($ J_{cd} = 7 $ Hz). The ratio $ \Delta\nu / J < 1 $, indicating strong second-order effects. The spectrum is complex and deviates significantly from a simple quartet.
- At 500 MHz, the chemical shift difference increases to $ \Delta\nu_{cd} = 50 $ Hz. The ratio $ \Delta\nu / J \approx 7.1 $. While not purely first-order, this ratio is much larger, leading to a simpler, less distorted spectrum compared to the 60 MHz spectrum.
The protons labeled 'b' also show some change, but the coupling interaction between 'c' and 'd' is the most sensitive to field strength due to the very small initial chemical shift difference.
Conclusion
Therefore, the set of protons $CH_3CH_2\underline{CH_2}OCH_3$ (protons 'c') would exhibit different splitting patterns in high and low field NMR due to the pronounced influence of second-order effects at lower field strength.
Important Questions from NMR Spectroscopy (1H and 13C)
In the $^1H$-NMR spectrum of the following molecule, the signal of proton $H_a$ appears as

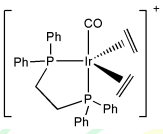
The $^1H$ NMR spectrum of the given iridium complex at room temperature gave a single signal at 2.6 ppm, and its $^{31}P$ NMR spectrum gave a single signal at 23.0 ppm. When the spectra were recorded at lower temperatures, both these signals split into a complex pattern. The intra-molecular dynamic processes shown by this molecule are
Compound K displayed a strong band at $1680 \text{ cm}^{-1}$ in its IR spectrum. Its $^1H$-NMR spectral data are as follows: $\delta$ (ppm) 7.30 (d, J = 7.2 Hz, 2H), 6.8 (d, J = 7.2 Hz, 2H), 3.8 (septet, J = 7.0 Hz, 1H), 2.2 (s, 3H), 1.9 (d, J = 7.0 Hz, 6H). The correct structure of compound K is
$^1H$ NMR spectrum of a mixture containing $CH_3Br$ ($x$ mol) and $(CH_3)_3CBr$ ($y$ mol) shows two singlets at 2.7 ppm and 1.8 ppm, with the relative ratio of 3:1 (integration value), respectively. The value of $x/y$ is ____________
(rounded off to the nearest integer)Consider the following $^1H$-NMR ($400$ MHz, DMSO-$d_6$) data of a compound:
$\delta$ in ppm: $3.85$ (s, $6H$), $6.73$ (t, $J = 2.2$ Hz, $1H$), $7.1$ (d, $J = 2.2$ Hz, $2H$), and $13.05$ (brs, $1H$).
The compound is


