
The ratio of the road accidents due to Bus in the year 2008 to that by Car in the year 2012 is: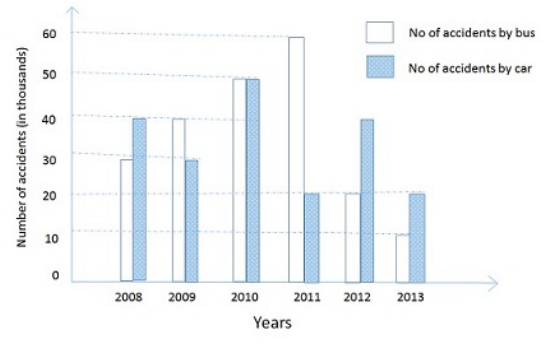
2:3
The ratio is derived from the graph by comparing the number of accidents for Bus in 2008 and Car in 2012. The correct ratio is 3:4.
Similar Questions
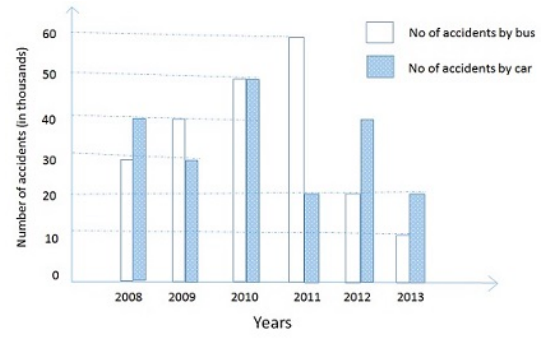
The Bar graphs represent the number of road accidents due to bus and car during the years 2008 - 2013. Study the graph and answer the questions. The total number of road accidents in the year 2009, 2011 and 2013 combined together is:
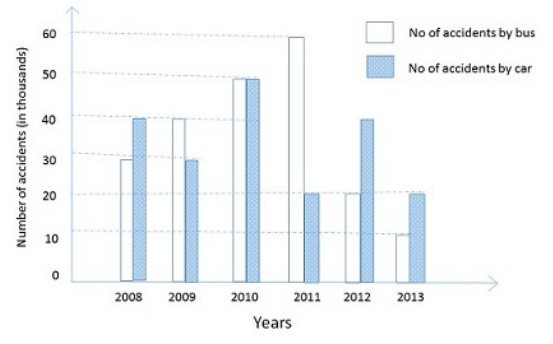
The respective ratio between the accidents by cars in the year 2012, 2010 and 2009 is:
Which of the following goods needs further transformation in the economic process?
Important Questions from Inflation
India has experienced persistent and high food inflation in the recent past. What could be the reasons?
1) Due to a gradual switchover to the cultivation of commercial crops, the area under the cultivation of food grains has steadily decreased in the last five years by about 30%.
2) As a consequence of increasing incomes, the consumption patterns of the people have undergone a significant change.
3) The food supply chain has structural constraints.
Which of the statements given above are correct?
A rapid increase in the rate of inflation is sometimes attributed to the "base effect". What is "base effect”?
Consider the following statements:
1. Inflation benefits the debtors.
2. Inflation benefits the bond-holders.
Which of the statements given above is/are correct?
Which one of the following is likely to be the most inflationary in its effect?
Hill Area Development Programmes were initiated during the _____________ Year Plan covering 15 districts.



