
The pie chart given below shows the expenditure (in percentage) of Aditya. The monthly income of Aditya is ₹54,000. How much does he spend (in ₹) on Food?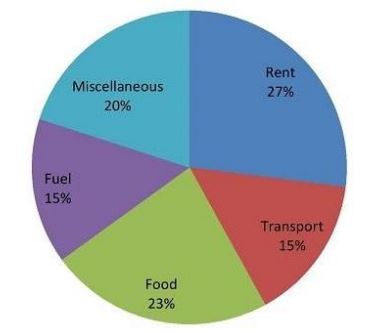
₹12,420
Monthly income of Aditya = ₹54,000
Percentage spent on Food = 23%
Formula used:
Amount spent on Food = (Percentage on Food × Total Income) / 100
Calculations:
Amount spent on Food = (23 × 54000) / 100
⇒ Amount spent on Food = 1242000 / 100
⇒ Amount spent on Food = ₹12,420
∴ Aditya spends ₹12,420 on Food.
Similar Questions
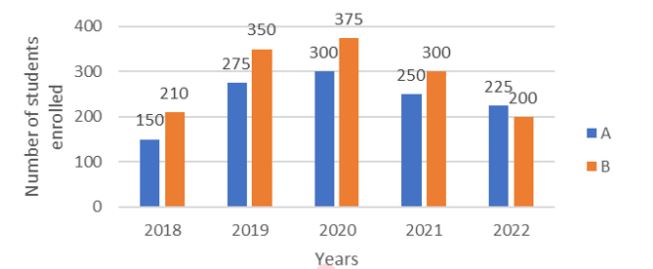
The given bar graph shows the number of students enrolled in Institutes A and B during 5 years (2018 to 2022). What is the ratio of the total students enrolled in Institute B in 2019, 2020, and 2022 to that of the total students enrolled in Institute A in 2018, 2020, and 2021?
Important Questions from Bar Graph and Pie Chart
Sales of books from four shops (B1, B2, B3, B4) in thousands are given as below. Study the graph and answer the following questions
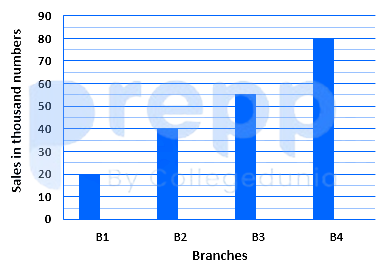
The number of shop in which sales of books are below the average level is:
- Sales of books from four shops (B1, B2, B3, B4) in thousands are given as below. Study the graph and answer the following questions.
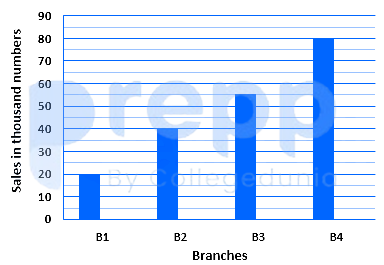
The average sales of book from shop B1, B2 and B4 is closest to:
The following tables show the product sold by a shopping app in 3 years. Find the average number of clothes sold by the app in all three years.
Products
2019
2020
2021
Cloth
824
476
500
Electronics
750
820
450
Makeup
660
810
510
Footwear
470
390
790
The table given below shows the number of male and female in different states.
States Male Female A 50 100 B 200 150 C 300 25 D 25 50 E 125 75 F 150 250 J1 = The value of average number of males in A and B.
J2 = The value of average number of females in E and F.
What is the value of (J2 - J1)?
A graph that displays data that changes Continuously over periods of time is-



