
The table given below shows the number of male and female in different states. J1 = The value of average number of males in A and B. J2 = The value of average number of females in E and F. What is the value of (J2 - J1)? States Male Female A 50 100 B 200 150 C 300 25 D 25 50 E 125 75 F 150 250
37.5
The problem asks us to calculate two average values, J1 and J2, based on the data provided in the table, and then find the difference between J2 and J1.
First, let's look at the given table showing the number of male and female individuals in different states:
| States | Male | Female |
|---|---|---|
| A | 50 | 100 |
| B | 200 | 150 |
| C | 300 | 25 |
| D | 25 | 50 |
| E | 125 | 75 |
| F | 150 | 250 |
Calculating J1: Average Number of Males in A and B
J1 is defined as the average number of males in states A and B. To find the average, we sum the number of males in A and B and divide by 2.
- Number of males in State A = 50
- Number of males in State B = 200
The sum of males in A and B is:
\( \text{Total males (A and B)} = 50 + 200 = 250 \)
The average number of males in A and B (J1) is:
\( J1 = \frac{\text{Total males (A and B)}}{2} = \frac{250}{2} = 125 \)
So, the value of J1 is 125.
Calculating J2: Average Number of Females in E and F
J2 is defined as the average number of females in states E and F. To find this average, we sum the number of females in E and F and divide by 2.
- Number of females in State E = 75
- Number of females in State F = 250
The sum of females in E and F is:
\( \text{Total females (E and F)} = 75 + 250 = 325 \)
The average number of females in E and F (J2) is:
\( J2 = \frac{\text{Total females (E and F)}}{2} = \frac{325}{2} = 162.5 \)
So, the value of J2 is 162.5.
Calculating the Difference (J2 - J1)
The question asks for the value of (J2 - J1). Now that we have calculated both J1 and J2, we can find their difference.
- Value of J2 = 162.5
- Value of J1 = 125
The difference (J2 - J1) is:
\( \text{Difference} = J2 - J1 = 162.5 - 125 \)
\( \text{Difference} = 37.5 \)
The value of (J2 - J1) is 37.5.
This matches one of the given options.
Revision Table: Data Analysis Key Terms
| Term | Definition | How it applies here |
|---|---|---|
| Average | Sum of values divided by the number of values. | Used to calculate J1 (average males) and J2 (average females). |
| Data Interpretation | The process of reviewing data through some predefined processes which will help assign some meaning to the data and arrive at a relevant conclusion. | Understanding the table and calculating values based on the data. |
| Difference | The result of subtracting one number from another. | Used to find the final answer (J2 - J1). |
Additional Information: Understanding Averages in Data
The average, also known as the mean, is a fundamental concept in statistics and data analysis. It provides a single value that represents the typical or central value of a set of numbers.
- Why use averages? Averages help in summarizing large datasets into a single, understandable figure. They allow for easy comparison between different sets of data.
- Calculating Simple Average: The formula for a simple average of a set of numbers \( x_1, x_2, ..., x_n \) is \( \text{Average} = \frac{x_1 + x_2 + ... + x_n}{n} \), where \( n \) is the count of numbers in the set.
- Application: Averages are widely used in various fields like economics (average income), sports (average score), science (average temperature), and education (average marks).
- Other Averages: While the mean is most common, other types of averages exist, such as the median (the middle value) and the mode (the most frequent value). Each is useful in different contexts depending on the nature of the data and the analysis goal.
In this problem, calculating the average number of males and females helped us distill information from the raw data and perform a comparison by finding the difference between these averages.
Important Questions from Bar Graph and Pie Chart
Sales of books from four shops (B1, B2, B3, B4) in thousands are given as below. Study the graph and answer the following questions
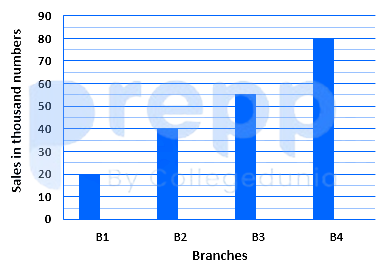
The number of shop in which sales of books are below the average level is:
- Sales of books from four shops (B1, B2, B3, B4) in thousands are given as below. Study the graph and answer the following questions.
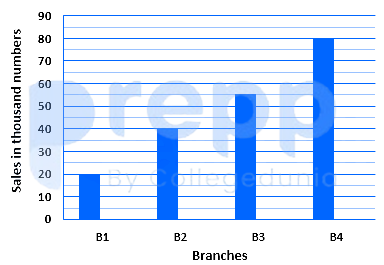
The average sales of book from shop B1, B2 and B4 is closest to:
The following tables show the product sold by a shopping app in 3 years. Find the average number of clothes sold by the app in all three years.
Products
2019
2020
2021
Cloth
824
476
500
Electronics
750
820
450
Makeup
660
810
510
Footwear
470
390
790
A graph that displays data that changes Continuously over periods of time is-
The pie chart given below shows the expenditure (in percentage) of Aditya. The monthly income of Aditya is ₹54,000.
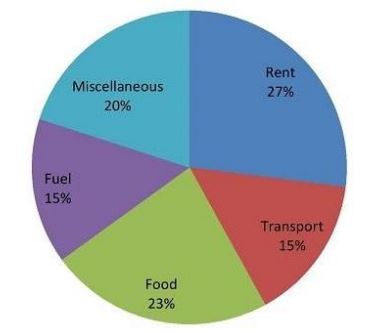
How much does he spend (in ₹) on Food?


