
The interaction between an antigen (Ag) and a single-chain antibody (Ab) was studied using Scatchard analysis. The result is shown below. The affinity of interaction and the total concentration of antibody, respectively, can be determined from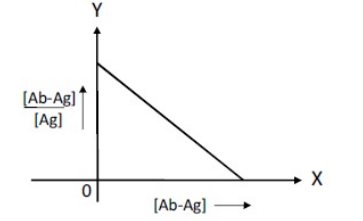
The question asks us to determine the affinity of interaction and the total concentration of antibody using a Scatchard plot. The plot typically represents the ratio of bound to free antigen concentration on the Y-axis versus bound antigen concentration on the X-axis. The binding affinity and antibody concentration can be determined using the line equation from the graph:
- Understanding the Scatchard Plot: The general equation of a Scatchard plot is: \(\frac{[Ab-Ag]}{[Ag]} = K_a([Ab]_T - [Ab-Ag])\), where Ka is the association constant and \([Ab]_T\) is the total antibody concentration.
- Line Equation: This can be rewritten in the form y = mx + c, which helps deduce slope = \(-K_a\) and Y-intercept = \(K_a[Ab]_T\).
- Determining the Affinity and Total Antibody Concentration: From the plot:
- The slope gives the negative of the affinity constant (\(-K_a\)).
- The X-intercept provides information on \([Ab]_T\) as the point where the bound antigen equals the total antibody concentration.
- Conclusion: Therefore, the affinity of interaction is determined by the slope, and the total concentration of antibody is determined by the X-intercept.
- Correct Option: The correct answer is slope and X-intercept.
Important Questions from Antigen Antibody Reaction
- The pair(s) of lanthanide ions whose ground state term symbols have same spin multiplicity (2S+1) and orbital angular momentum (L), but different spin-orbit coupling (J) is(are)
(Given: Atomic number: Nd = 60; Pm = 61; Ho = 67; Er = 68) Generally, the coordination number and the nature of the electronic absorption band ($f\rightarrow f$transition) of lanthanide (III) ion in their complexes are, respectively,
- The calculated and observed magnetic moments differ considerably for an aqua complex of a lanthanide(III) ion as a result of low lying states of high J. The ion, among the following, is
- The correct electronic configuration and spin only magnetic moment of $Gd^{3+}$ (at.no. 64) are
- If a denatured protein of human origin is injected into a rabbit, antibodies generated will recognize the __________ structure of the protein.


